Running the test script below gives me the image I have attached, which looks like it has been smoothed.
Does imshow perform some sort of smoothing on the data it displays? If so, is there a way to turn this off?
#!/usr/bin/env python
from pylab import *
data = array([[1,2,3,4],[5,6,7,8]])
imshow(data,interpolation=None)
savefig('output.png')
close('all')
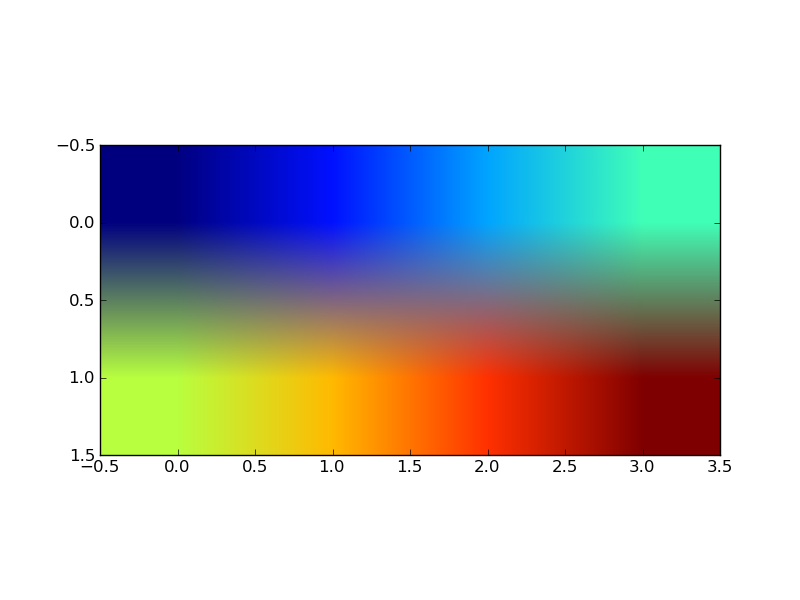
Yes. Use interpolation='nearest' instead.
Gary R.
Michael Hearne wrote:
···
Running the test script below gives me the image I have attached, which looks like it has been smoothed.
Does imshow perform some sort of smoothing on the data it displays? If so, is there a way to turn this off?
#!/usr/bin/env python
from pylab import *
data = array([[1,2,3,4],[5,6,7,8]])
imshow(data,interpolation=None)
savefig('output.png')
close('all')
You may also want to take a look at the brand-spanking-new image
tutorial, which covers this
http://matplotlib.sourceforge.net/users/image_tutorial.html
JDH
···
On Tue, Sep 22, 2009 at 3:45 PM, Michael Hearne <mhearne@...924...> wrote:
Great!