Hi all,
I’m plotting some data with imshow(). On the screen it looks good, but when printed (it’s part of a paper) it’s hard to see because it all looks blue or black.
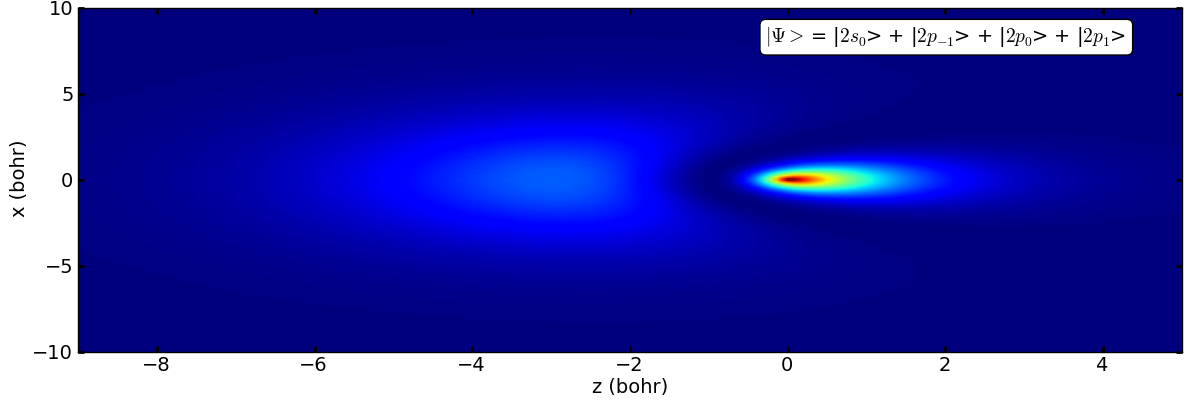
I’m attaching an example.
What I would like to do it have a colormap which is transparent for lower values of data and opaque for high values, so the blue on the figure would appear white/transparent.
Is it possible? How to achieve this? alpha options seems to accept only a float for a uniform transparency.
Thanx!
N
Correct, most plotting functions in mpl assume a scalar alpha channel, but the backend of mpl does not have this restriction.
The colormap object itself is not restricted to a single value for the alpha channel. I would imagine, although I have not tried this myself, that it would be possible to modify the colormap object’s alpha values in the self._lut rgba array. Note that self._lut for a Colormap object is not created right away, only when it needs to make a color from a value.
I don’t know if that helps at all, but good luck!
Ben Root
···
On Thu, Sep 30, 2010 at 4:59 PM, Nicolas Bigaouette <nbigaouette@…287…> wrote:
Hi all,
I’m plotting some data with imshow(). On the screen it looks good, but when printed (it’s part of a paper) it’s hard to see because it all looks blue or black.
I’m attaching an example.
What I would like to do it have a colormap which is transparent for lower values of data and opaque for high values, so the blue on the figure would appear white/transparent.
Is it possible? How to achieve this? alpha options seems to accept only a float for a uniform transparency.
Thanx!
N
From: Nicolas Bigaouette [mailto:nbigaouette@…985…]
Sent: Thursday, September 30, 2010 18:00
What I would like to do it have a colormap which is transparent for lower values of data and opaque for high values, so the blue on the figure would appear white/transparent.
Would it suffice for the colormap to be light or white for low values but still opaque? There are several built-in maps [1] with a light color at one end; if it’s light at the high end, append “_r” to the colormap name to get the reversed version.
[1] http://matplotlib.sourceforge.net/examples/pylab_examples/show_colormaps.html
I guess it’s the best solution for now. Thanks 
···
On Fri, Oct 1, 2010 at 5:38 PM, Stan West <stan.west@…706…> wrote:
From: Nicolas Bigaouette [mailto:nbigaouette@…287… ]
Sent: Thursday, September 30, 2010 18:00
What I would like to do it have a colormap which is transparent for lower values of data and opaque for high values, so the blue on the figure would appear white/transparent.
Would it suffice for the colormap to be light or white for low values but still opaque? There are several built-in maps [1] with a light color at one end; if it’s light at the high end, append “_r” to the colormap name to get the reversed version.
[1] http://matplotlib.sourceforge.net/examples/pylab_examples/show_colormaps.html
Nicolas,
It would be extremely useful if you could file a feature request for this at our tracker:
http://sourceforge.net/tracker/?atid=560723&group_id=80706&func=browse
This way, your suggestion won’t get lost.
Ben Root
···
On Sat, Oct 2, 2010 at 10:37 AM, Nicolas Bigaouette <nbigaouette@…287…> wrote:
On Fri, Oct 1, 2010 at 5:38 PM, Stan West <stan.west@…706…> wrote:
From: Nicolas Bigaouette [mailto:nbigaouette@…287… ]
Sent: Thursday, September 30, 2010 18:00
What I would like to do it have a colormap which is transparent for lower values of data and opaque for high values, so the blue on the figure would appear white/transparent.
Would it suffice for the colormap to be light or white for low values but still opaque? There are several built-in maps [1] with a light color at one end; if it’s light at the high end, append “_r” to the colormap name to get the reversed version.
[1] http://matplotlib.sourceforge.net/examples/pylab_examples/show_colormaps.html
I guess it’s the best solution for now. Thanks