Hi,
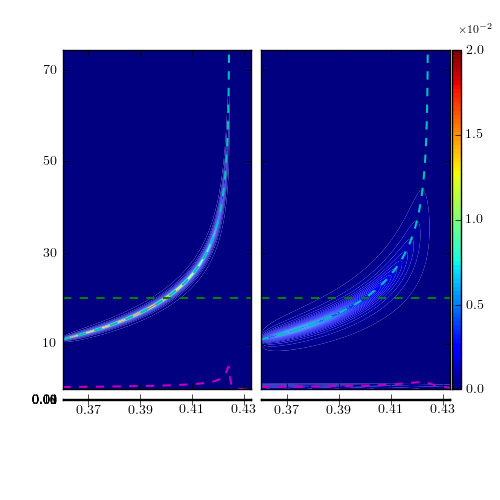
From the attached figure, you can see that the plots I am trying to show in the bottom two “quadrants”, are too narrow. That is because the y-axis of those two plots is meant to be in the 0-1 range, i.e. much smaller than y-axis in the upper two, so the height of the bottom grid boxes is tiny. How can I force the heights of all boxes to be the same?
Much appreciated,
Ron
If you don't care about the aspect ratio at all, you can use
aspect="auto". Check the thread below.
http://old.nabble.com/Re%3A-Can-I-change-pixel-aspect-with-axes_grid-p32300471.html
Regards,
-JJ
···
On Sat, Aug 13, 2011 at 5:01 AM, R. O'Gara <ronogara@...9...> wrote:
Hi,
From the attached figure, you can see that the plots I am trying to show in
the bottom two "quadrants", are too narrow. That is because the y-axis of
those two plots is meant to be in the 0-1 range, i.e. much smaller than
y-axis in the upper two, so the height of the bottom grid boxes is tiny. How
can I force the heights of all boxes to be the same?
Much appreciated,
Ron
------------------------------------------------------------------------------
FREE DOWNLOAD - uberSVN with Social Coding for Subversion.
Subversion made easy with a complete admin console. Easy
to use, easy to manage, easy to install, easy to extend.
Get a Free download of the new open ALM Subversion platform now.
http://p.sf.net/sfu/wandisco-dev2dev
_______________________________________________
Matplotlib-users mailing list
Matplotlib-users@lists.sourceforge.net
matplotlib-users List Signup and Options