Hi All,
I am currently trying to plot 4 points (but they will be more, in
an animated sequence later), and I am trying to use an image as a
point marker. I am using the axes transData transform to get the point
coordinates from the data world to the display world.
Everything seems to be working OK (i.e., the images are placed
correctly close to the plot points); however, as soon as I try to
force the axes into an "equal" aspect ratio with this command:
ax.set_aspect('equal')
Then all the calculations are messed up and the images end up very far
from the plot points. I have tried also the approach mentioned in this
StackOverflow post:
http://stackoverflow.com/questions/2318288/how-to-use-custom-marker-with-plot
But I get the same wrong answer when I set the "equal" aspect ratio
for the axes.
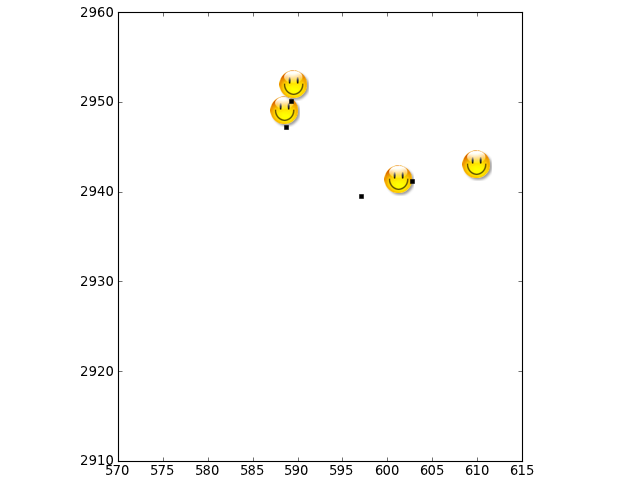
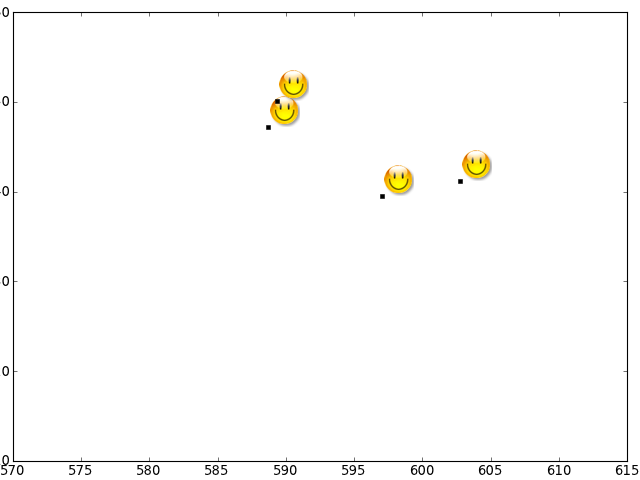
I am attaching a small sample application which demonstrates the
problem, a small "smiley.png" image needed to run the script and two
plots generated by my script, one with the "equal" aspect ratio and
the other without.
I appreciate any suggestion, as I feel I am missing something important...
Thank you in advance.
Andrea.
"Imagination Is The Only Weapon In The War Against Reality."
http://xoomer.alice.it/infinity77/
# ------------------------------------------------------------- #
def ask_mailing_list_support(email):
if mention_platform_and_version() and include_sample_app():
send_message(email)
else:
install_malware()
erase_hard_drives()
# ------------------------------------------------------------- #
image_in_axes.py (1.2 KB)

Andrea,
The source of the problem is that the transformation you are using has not been updated to account for your set_aspect call. I played around a little bit, but I'm not sure how to force mpl to update the transform. Perhaps someone else can comment. This is a very fragile way to do things anyway because figimage places the image in screen coordinates and you really would like to place it relative to the axis.
Eric
···
-----Original Message-----
From: Andrea Gavana [mailto:andrea.gavana@…287…]
Sent: Wednesday, September 19, 2012 11:09 AM
To: matplotlib-users@lists.sourceforge.net
Subject: [Matplotlib-users] Image as marker and axes "equal" aspect
ratio
Hi All,
I am currently trying to plot 4 points (but they will be more, in
an animated sequence later), and I am trying to use an image as a point
marker. I am using the axes transData transform to get the point
coordinates from the data world to the display world.
Everything seems to be working OK (i.e., the images are placed
correctly close to the plot points); however, as soon as I try to force
the axes into an "equal" aspect ratio with this command:
ax.set_aspect('equal')
Then all the calculations are messed up and the images end up very far
from the plot points. I have tried also the approach mentioned in this
StackOverflow post:
python - How to use custom png image marker with plot? - Stack Overflow
with-plot
But I get the same wrong answer when I set the "equal" aspect ratio for
the axes.
I am attaching a small sample application which demonstrates the
problem, a small "smiley.png" image needed to run the script and two
plots generated by my script, one with the "equal" aspect ratio and the
other without.
I appreciate any suggestion, as I feel I am missing something
important...
Thank you in advance.
Andrea.
"Imagination Is The Only Weapon In The War Against Reality."
http://xoomer.alice.it/infinity77/
# ------------------------------------------------------------- # def
ask_mailing_list_support(email):
if mention_platform_and_version() and include_sample_app():
send_message(email)
else:
install_malware()
erase_hard_drives()
# ------------------------------------------------------------- #
Hi Eric, All,
From: Andrea Gavana [mailto:andrea.gavana@…287…]
Sent: Wednesday, September 19, 2012 11:09 AM
To: matplotlib-users@lists.sourceforge.net
Subject: [Matplotlib-users] Image as marker and axes "equal" aspect
ratio
Hi All,
I am currently trying to plot 4 points (but they will be more, in
an animated sequence later), and I am trying to use an image as a point
marker. I am using the axes transData transform to get the point
coordinates from the data world to the display world.
Everything seems to be working OK (i.e., the images are placed
correctly close to the plot points); however, as soon as I try to force
the axes into an "equal" aspect ratio with this command:
ax.set_aspect('equal')
Then all the calculations are messed up and the images end up very far
from the plot points. I have tried also the approach mentioned in this
StackOverflow post:
python - How to use custom png image marker with plot? - Stack Overflow
with-plot
But I get the same wrong answer when I set the "equal" aspect ratio for
the axes.
I am attaching a small sample application which demonstrates the
problem, a small "smiley.png" image needed to run the script and two
plots generated by my script, one with the "equal" aspect ratio and the
other without.
I appreciate any suggestion, as I feel I am missing something
important...
The source of the problem is that the transformation you are using has not been updated to account for your set_aspect call. I played around a little bit, but I'm not sure how to force mpl to update the transform. Perhaps someone else can comment. This is a very fragile way to do things anyway because figimage places the image in screen coordinates and you really would like to place it relative to the axis.
Thank you for your answer and for taking the time to play with the
sample I posted. I know that using figimage is not exactly the best
way to go, but I can only think of two other approaches:
1) Use imshow: from the documentation, it appears to me that you can't
place an image wherever you want, and I was unable to find any example
on how to use imshow to place multiple images in a specific place
inside the axes;
2) Use scatter: again, from the docs it seems that scatter supports
symbols, mathtext, paths and regular polygons, but no images...
I may of course be wrong about the above statements, and again I
welcome any suggestion you may have.
Thank you.
Andrea.
"Imagination Is The Only Weapon In The War Against Reality."
http://xoomer.alice.it/infinity77/
···
On 21 September 2012 15:46, Moore, Eric (NIH/NIDDK) [F] wrote:
-----Original Message-----
I recommend you to use OffsetImage. Here is an example of how one can
use OffsetImage.
http://matplotlib.org/examples/pylab_examples/demo_annotation_box.html
And attached is the modified version of the original script.
Regards,
-JJ
image_in_axes.py (1.37 KB)
Thank you JJ, I wasn't aware of OffsetImage. It works perfectly now,
thanks again.
Andrea.
"Imagination Is The Only Weapon In The War Against Reality."
http://xoomer.alice.it/infinity77/
···
On 22 September 2012 16:57, Jae-Joon Lee wrote:
I recommend you to use OffsetImage. Here is an example of how one can
use OffsetImage.
http://matplotlib.org/examples/pylab_examples/demo_annotation_box.html
And attached is the modified version of the original script.