Hello,
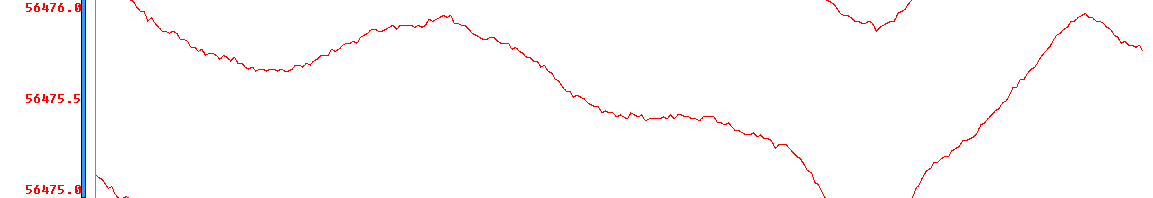
I'm using the RO.StripChartWdg module to plot real time data. The
data can vary quite a lot and rather than autoscale I want to set a
vertical scale and have it wrap. This is what I mean by wrapping…
when the value scrolls out of the extents of the window it reappears
on the opposite side. Ideally I would like to place a connecting bar
between them, but its not essential
There are lots of ways to accomplish this, but before I set out I
want to be sure I’m not reinventing the wheel. Is there a simple way
to accomplish this?
cheers,

Marc Pelletier
···
Do some modulo arithmetic on your Y values and lie (in your tick
labels) about the actual numeric values plotted on the Y axis?
Skip
···
On Tue, May 6, 2014 at 12:10 PM, Marc Pelletier <marc@...4529...> wrote:
Is there a simple way to accomplish this?
Hi Skip,
Something like that is probably what I will implement. I want the user to be able to change scale on the fly, so it means keeping 2 copies of the data. Not a big deal, but I just don't want to build something that already exists.
cheers,
Marc
Marc Pelletier, P. Geo.
Nutana Geophysics
Saskatoon, SK
tel: (306) 931-6853
cell: (306) 260-6022
···
On 06/05/2014 11:43 AM, Skip Montanaro wrote:
On Tue, May 6, 2014 at 12:10 PM, Marc Pelletier > <marc@...4529...> wrote:
Is there a simple way to accomplish this?
Do some modulo arithmetic on your Y values and lie (in your tick
labels) about the actual numeric values plotted on the Y axis?
Skip