Hi
This is my code
import numpy as np;
import matplotlib; import matplotlib.pyplot as plt

frequency = np.array([0.0000,0.0125,0.0750,0.1250,0.2250,0.2000,0.2125,0.1000,0.0375,0.0125])
value_scale = np.arange(0, len(frequency), 1)

mu = 5; sigma = 2; params = ([mu, sigma])
gaussian = 1/(sigma*np.sqrt(2*np.pi)) * np.exp(-(value_scale-mu)**2/(2*sigma**2))

Module_square = (frequency - gaussian)**2
SSR = np.sum(Module_square)

mu_set = np.arange(0, 10, 0.01); sigma_set = np.arange(0.5, 5.5, 0.01)
mu_scale = mu_set; sigma_scale = np.matrix(sigma_set); value_mesh_scale = np.matrix(value_scale)
gaussian_mu = np.empty((len(sigma_scale), len(frequency)))
cycle = 0

for mu_var in mu_scale:
    gaussian_mu = np.exp(1/2*np.square(sigma_scale.T)*(-np.square(value_mesh_scale-mu_var)))/(sigma_scale.T*np.sqrt(2*np.pi))
    SSR_component = np.sum(np.matrix(np.square(frequency - gaussian_mu)), axis=1); cycle = cycle + 1
    if (cycle == 1):
        SSR_mesh = SSR_component
    else:
        SSR_mesh = np.hstack((SSR_mesh,SSR_component))

plt.figure(dpi=128); params = {"text.usetex":True, "font.family":"serif", "mathtext.fontset":"cm", "axes.titlesize": 16, "axes.labelsize":14, "figure.facecolor":"w"}
matplotlib.rcParams.update(params)

plt.pcolormesh(mu_scale, sigma_set, SSR_mesh, cmap="Blues_r", shading='gouraud')
plt.colorbar()

plt.show()
However, it notices me that
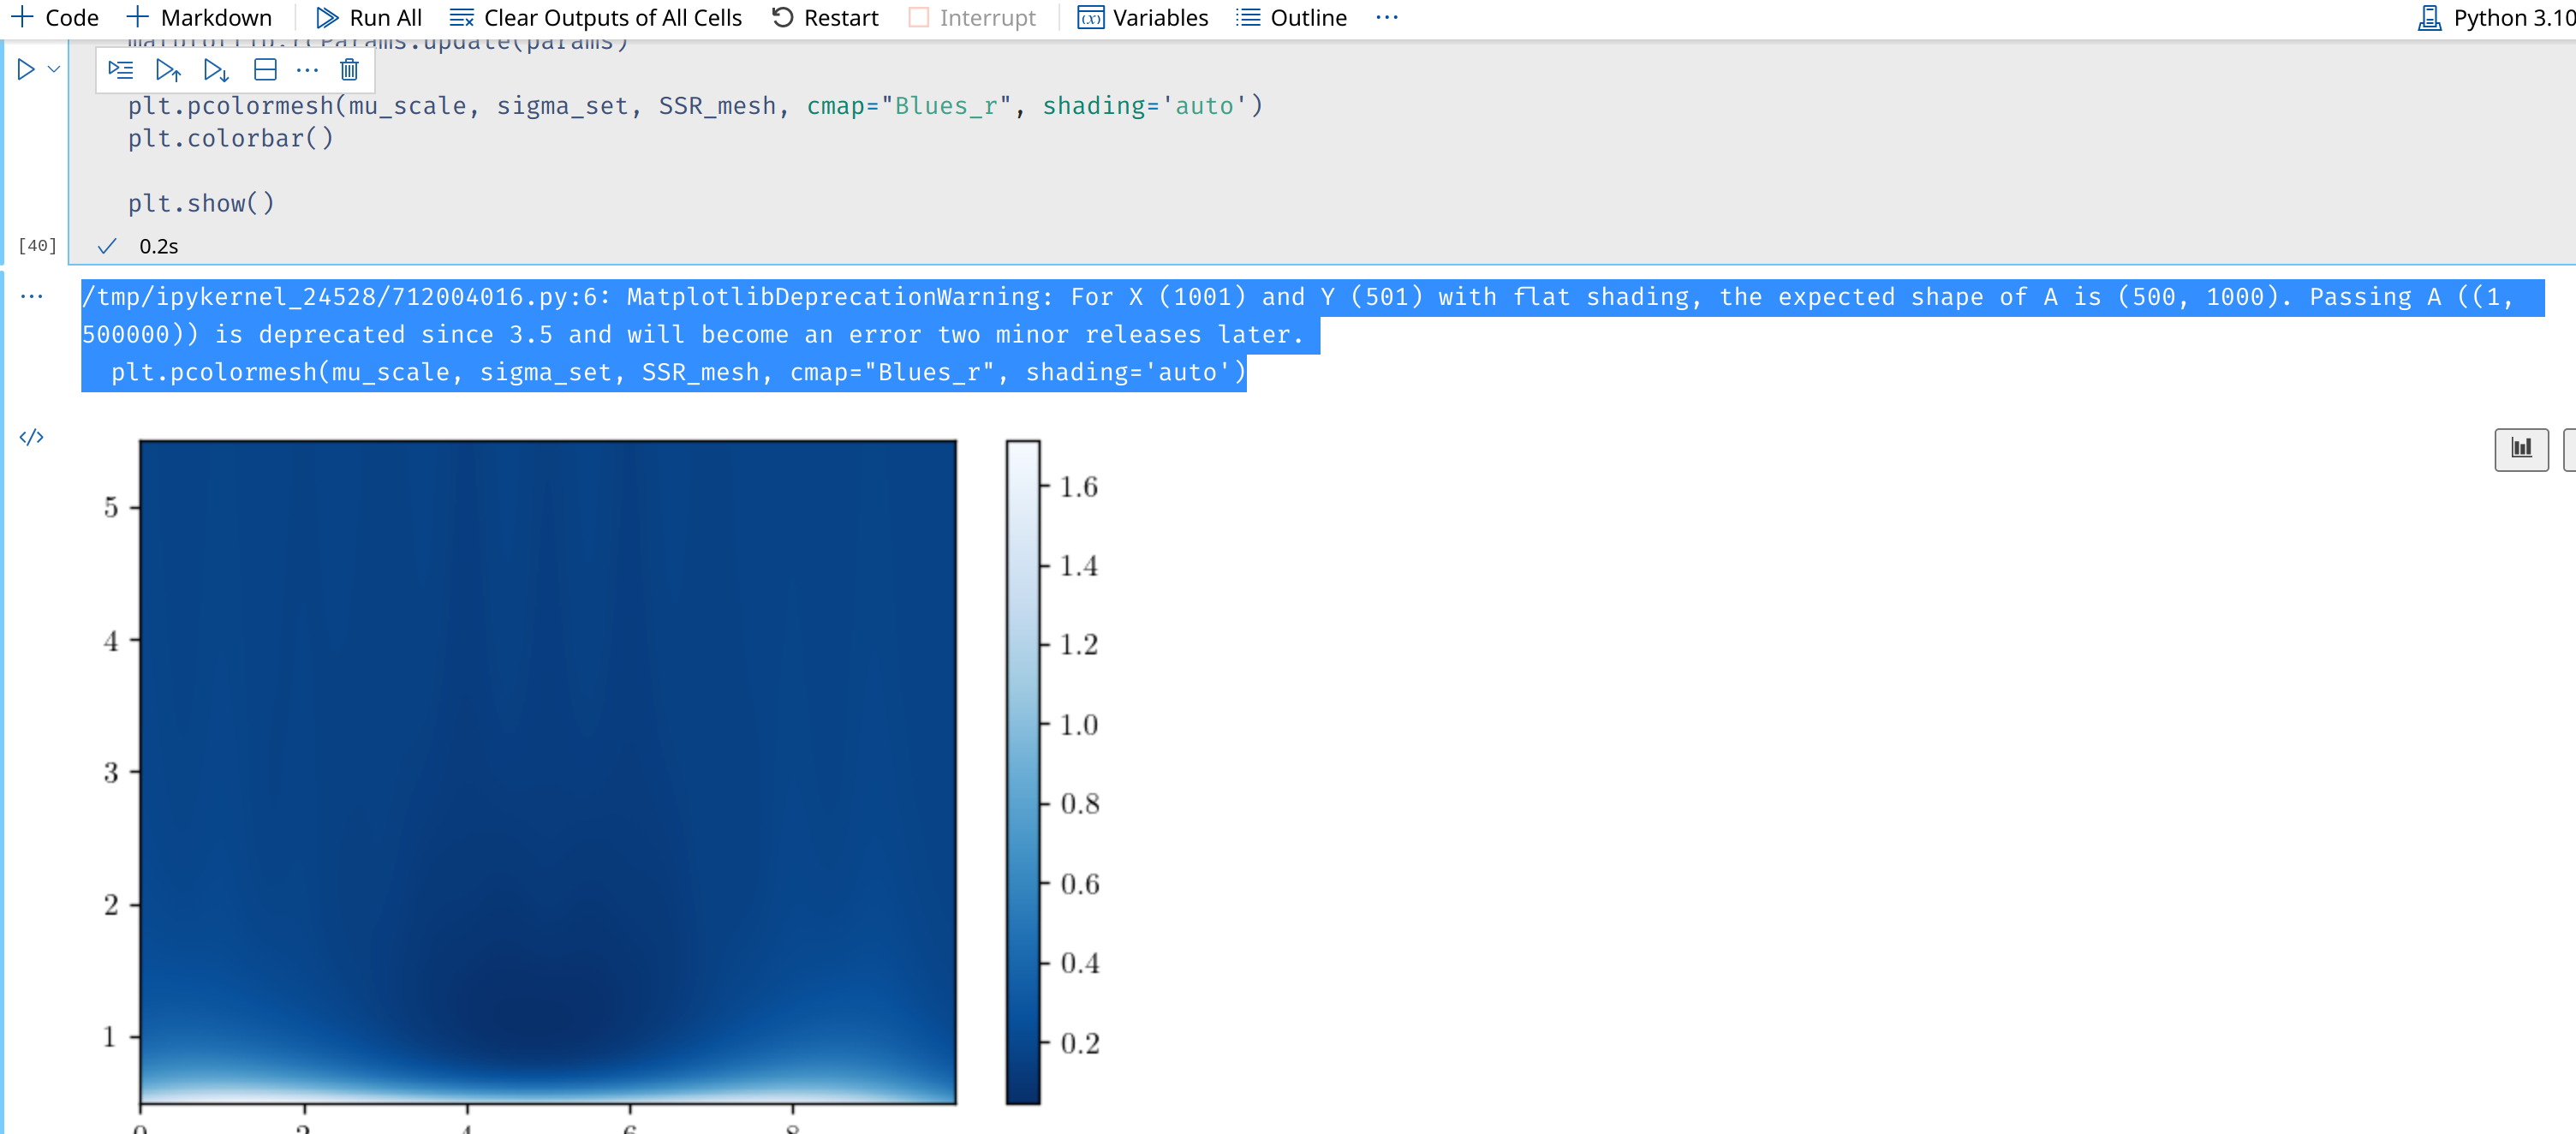
/tmp/ipykernel_24528/712004016.py:6: MatplotlibDeprecationWarning: For X (1001) and Y (501) with flat shading, the expected shape of A is (500, 1000). Passing A ((1, 500000)) is deprecated since 3.5 and will become an error two minor releases later.
  plt.pcolormesh(mu_scale, sigma_set, SSR_mesh, cmap="Blues_r", shading='auto')
I don’t want this warning. How to solve it?
Another question is that I want a logarithmical distributed colormap. How to realize it?
Thanks