Hello !
I’m a beginner in Python and I’m working on a project on Lotka Volterra model. I have a little problem with a legend on a figure.
This is my code :
from numpy import *
import numpy as np
from scipy import integrate
import matplotlib.pyplot as plt
import pylab as p

a, b, c, d = 1.0, 0.1, 1.5, 0.75
t = linspace(0, 15, 1000)
values  = linspace(0.3, 0.9, 10)

def dX_dt(X, t, a, b, c, d):
     return array([ a*X[0] - b*X[0]*X[1] , -c*X[1] + d*b*X[0]*X[1] ])

vcolors = p.cm.winter_r(linspace(0.1, 1.0, len(values)))
mcolors = p.cm.autumn_r(linspace(0.1, 1.0, len(values)))

fig3, ax = plt.subplots()
fig3.subplots_adjust(right=0.84, left=0.08)
plt.title('Populations en fonction du temps pour différentes conditions initiales',fontsize=15, y=1.05)

for v, col in zip(values, vcolors):
      X0 = array([ v*c/d , v*a/b ])
      X = integrate.odeint( dX_dt, X0, t, args=(a,b,c,d))
      ax.plot(t, X[:,0], lw=1, color=col, label='$X_0$=(%.f,%.f)' % (X0[0],X0[1]))
      ax.scatter(0, X0[0], s=40, marker='o',color=col) # Plot des conditions initiales

      plt.legend( loc=(1,0.5),
                       title = "Population des proies \n    Conditions initiales \n (Proies, Prédateurs)")

for v, col in zip(values, mcolors):
      X0 = array([ v*c/d , v*a/b ])
      X = integrate.odeint( dX_dt, X0, t, args=(a,b,c,d))
      ax.plot(t, X[:,1], lw=1, color=col, label='$X_0$=(%.f,%.f)' % (X0[0],X0[1]))
      ax.scatter(0, X0[1], s=40, marker='o',color=col)
      ax.legend( loc=(1.01,0),
                 title = "Population des prédateurs \n       Conditions initiales \n       (Proies, Prédateurs)")

plt.xlabel('Temps')
plt.ylabel('Populations')
mngr = plt.get_current_fig_manager()
mngr.window.setGeometry(0,70,1438,750)
Then I obtain this :
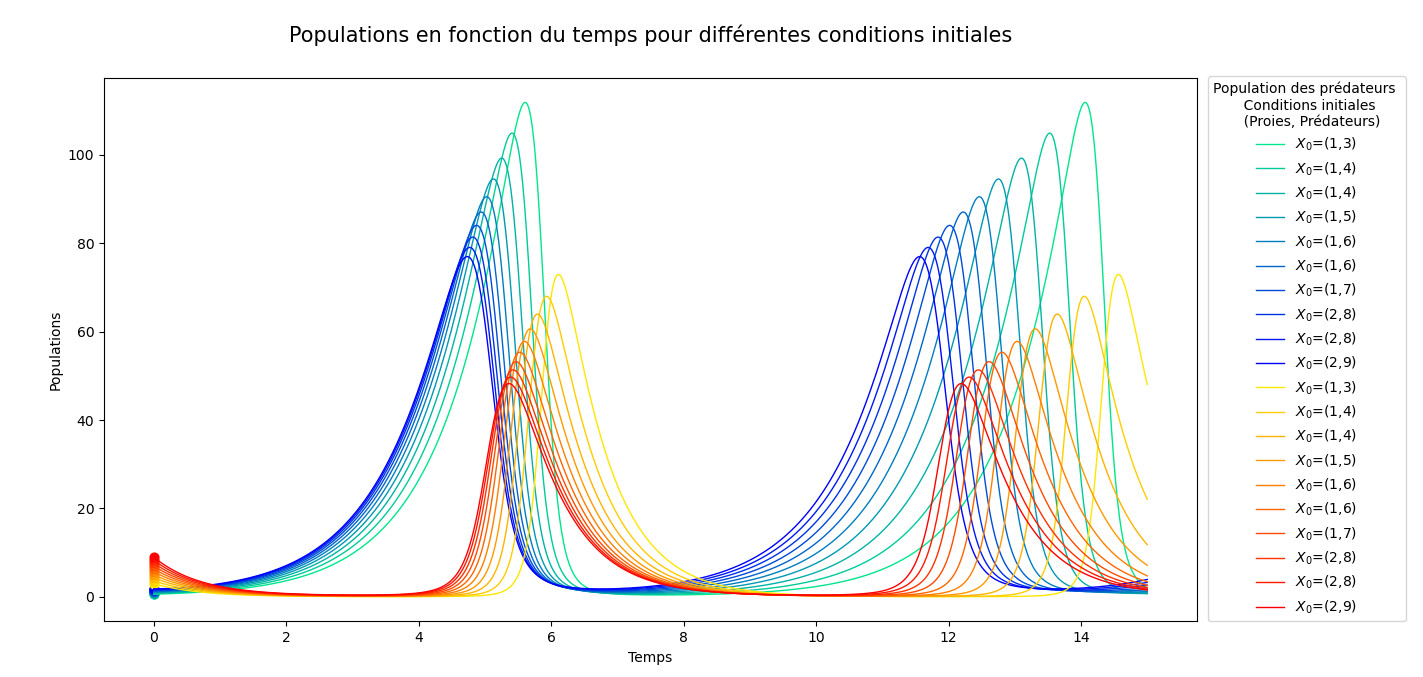
I want to separate the legend on two legends, one for the red line, and the other for the blue line, somebody can please help me ? I’ve already tested some stuff I’ve been seeing on this forum, but I think it’s not compatible with the way I code the different value of X_0… ![]()