Hi John,
>> Does fig = figure(frameon=False) do what you want?
> Apperently not:
>>>> from pylab import * x = range(10) figure(1, frameon=False,
>>>> facecolor='r') scatter(x, x) show()
I found the problem in the figure code and fixed it in svn. If you
don't have access to svn, you can manually set the attribute like
fig = figure(1, facecolor='r')
fig.frameon = False
If you have a backend that supports alpha, however, I would recommend
explicitly setting the alpha channel of the figure rectangle over this
approach
fig.figurePatch.set_alpha(0.0)
JDH
Hi John,
Unfortunately, that also didn't do what I wanted.
I tried a different backend today - Cairo, and got the same results
Code:
from pylab import *
x = range(10)
fig = figure(1, facecolor='r')
fig.frameon = False
scatter(x, x)
show()
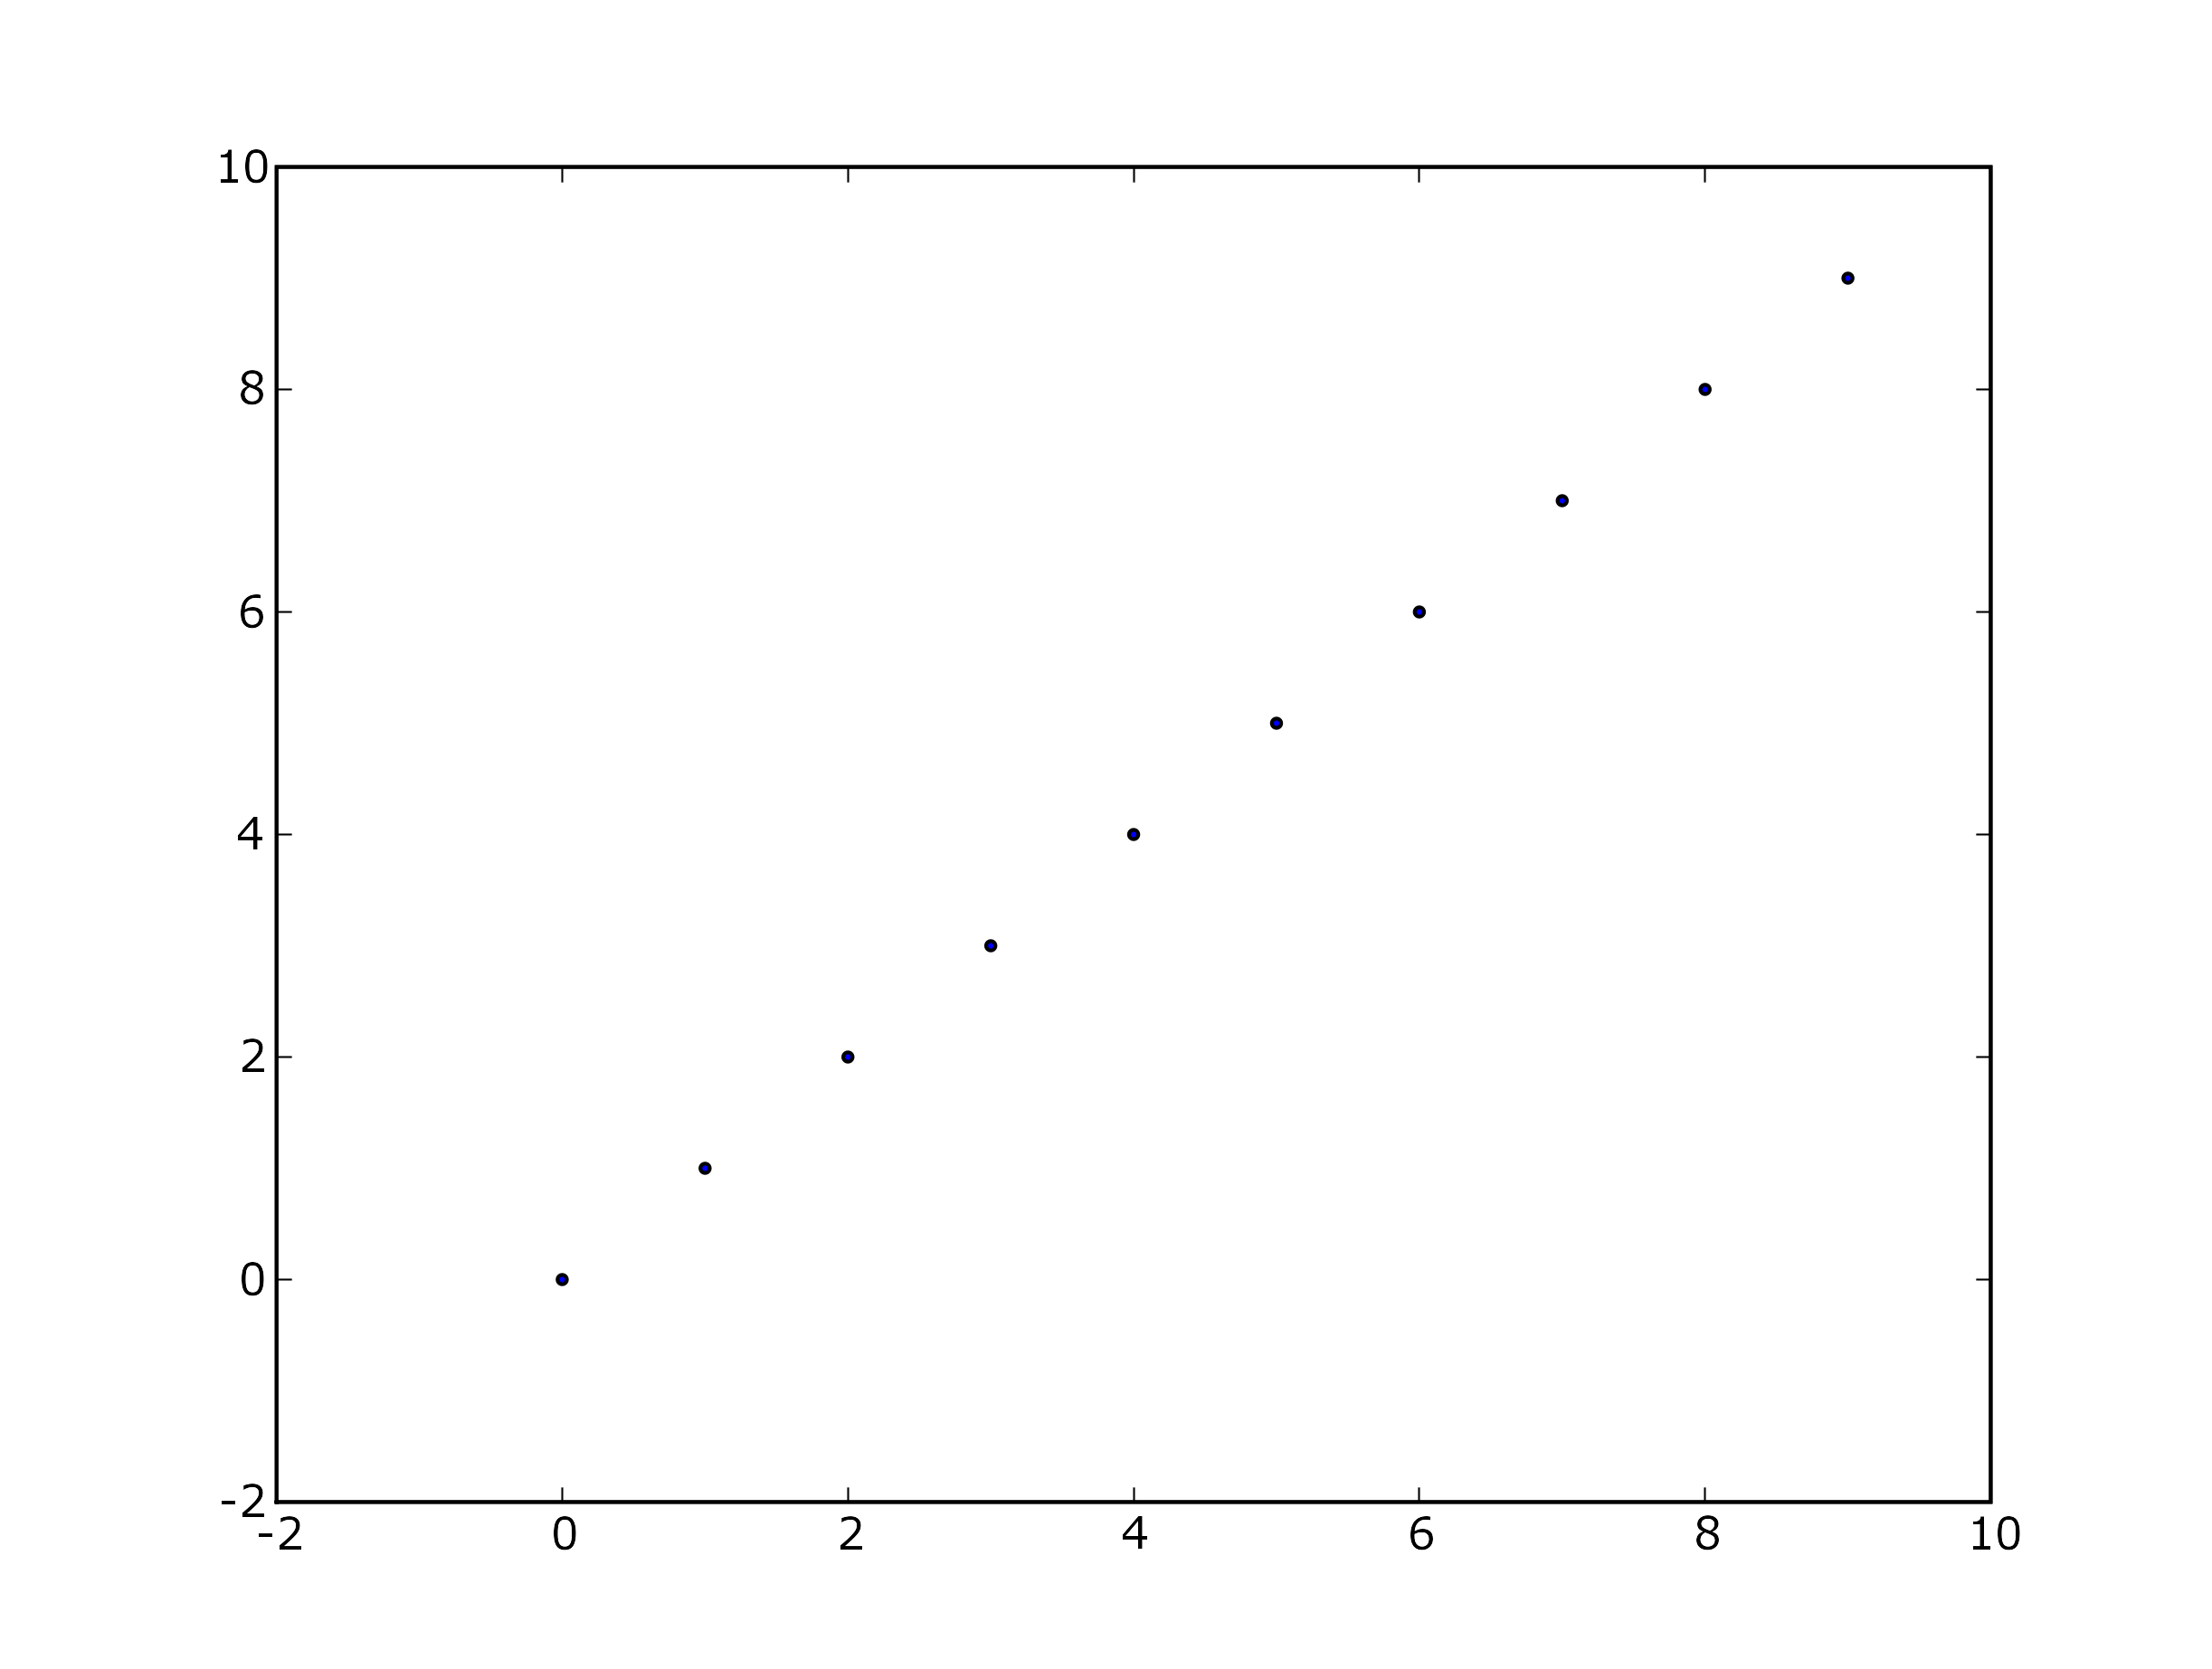
Results (given in attachment) are the pretty same picture, but without
the red. I just want the picture to take all the space till the axis
(I'll turn them off in production, but when they're turned on you get
the picture of what's wrong), so there's no (not even a px) white
space arround the axes.
If you look the picture in an viewer, zoom it out and set the
background to black you'll pretty much see the white are arround the
axes. I'ld like to get rid of that, that's if that's possible.
Regards,
···
--
Petar Marić
*e-mail: petar.maric@...287...
*mobile: +381 (64) 6122467
*icq: 224720322
*skype: petar_maric
*web: http://www.petarmaric.com/