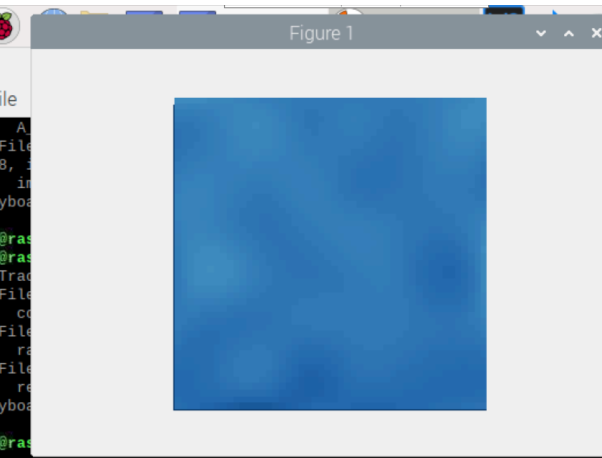
Hi, i search a way to remove the white border around the chart and if possible the top bar (grey bar, with “figure 1”)
To remove the toolbar i used: plt.rcParams[‘toolbar’] = ‘None’ → after import
To remove the axis i used: ax.axis(‘off’)
This is a part of my code:
grid_z = interp(zz)
fig, ax = plt.subplots(num=None, figsize=(5, 4), dpi=None, facecolor='None', edgecolor='None')
im1 = ax.imshow(grid_z,vmin=18,vmax=37,cmap=plt.cm.RdBu_r)
ax.axis('off')
fig.canvas.draw()
ax_bgnd = fig.canvas.copy_from_bbox(ax.bbox)
fig.show()
pix_to_read = 64
while True:
    status,pixels = sensor.read_temp(pix_to_read)
    if status:
        continue

    fig.canvas.restore_region(ax_bgnd) # restore background (speeds up run)
    new_z = interp(np.reshape(pixels,pix_res)) # interpolated image
    im1.set_data(new_z) # update plot with new interpolated temps
    ax.draw_artist(im1) # draw image again
    fig.canvas.blit(ax.bbox) # blitting - for speeding up run
    fig.canvas.flush_events() # for real-time plot