Dear All,
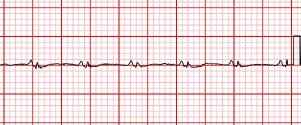
I am facing one peculiar problem. I have ecg data of 2000 points . I can plot it,but i want to plot the data on image . Kindly find the attched image with this mail to get my problem.How should I go ahead. Thanx in advance.
Regards
Yogesh
Dear All,
I am facing one peculiar problem. I have ecg data of 2000 points . I can plot it,but i want to plot the data on image . Kindly find the attched image with this mail to get my problem.How should I go ahead. Thanx in advance.
Regards
Yogesh
See the following demo, where some marker data (representing ECOG
electrodes) is plotted over a CT image
http://matplotlib.sourceforge.net/examples/pylab_examples/image_demo2.html
JDH
···
On Thu, Feb 18, 2010 at 2:01 AM, yogesh karpate <yogeshkarpate@...287...> wrote:
Dear All,
I am facing one peculiar problem. I have ecg data of 2000
points . I can plot it,but i want to plot the data on image . Kindly find
the attched image with this mail to get my problem.How should I go ahead.
Thanx in advance.