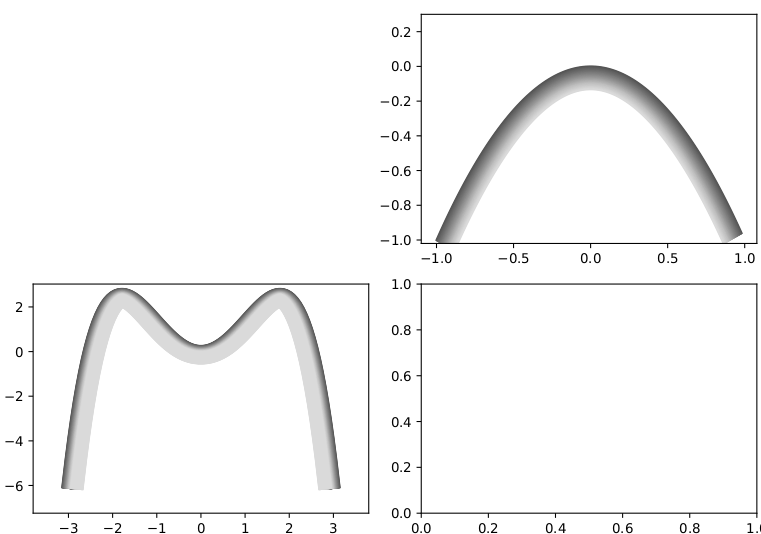
Hi, could I ask you for your help with the following script? How to edit the for cycles under #ax5 and #ax6 to plot graphs in the same fashion? Now, the lower figure has no colour transit, as opposed to the upper one. The colour transit appears in the lower figure after increasing of dpi, however, some unwanted stuff also appears. Is there a scalling problem? Thank you
import matplotlib.pyplot as plt
import numpy as np
from matplotlib.gridspec import GridSpec
import math

# Plot figure with size
fig, ax = plt.subplots()
plt.rcParams["figure.figsize"] = [8, 8]

def format_axes(fig):
for i, ax in enumerate(fig.axes):
    ax.tick_params(labelbottom=False, labelleft=False)

    for ax in [ax]:
        ax.set_yticks([])
        ax.set_xticks([])
# Removing axis
    for side in ['right','top','left','bottom']:
        ax.spines[side].set_visible(False)


# Function for plotting parallels to curves
def get_parallels(length=.1):

px, py = [], []

for idx in range(len(x)-1):
    x0, y0, xa, ya = x[idx], y[idx], x[idx+1], y[idx+1]
    dx, dy = xa-x0, ya-y0
    norm = math.hypot(dx, dy) * 1/length
    dx /= norm
    dy /= norm
    px.append(x0-dy)
    py.append(y0+dx)
return px, py

def offset(x,y, o):
""" Offset coordinates given by array x,y by o """
X = np.c_[x,y].T
m = np.array([[0,-1],[1,0]])
R = np.zeros_like(X)
S = X[:,2:]-X[:,:-2]
R[:,1:-1] = np.dot(m, S)
R[:,0] = np.dot(m, X[:,1]-X[:,0])
R[:,-1] = np.dot(m, X[:,-1]-X[:,-2])
On = R/np.sqrt(R[0,:]**2+R[1,:]**2)*o
Out = On+X
return Out[0,:], Out[1,:]

dpi = 20

def offset_curve(ax, x,y, o):
""" Offset array x,y in data coordinates
    by o in points """
trans = ax.transData.transform
inv = ax.transData.inverted().transform
X = np.c_[x,y]
Xt = trans(X)
xto, yto = offset(Xt[:,0],Xt[:,1],o*dpi/72. )
Xto = np.c_[xto, yto]
Xo = inv(Xto)
return Xo[:,0], Xo[:,1]


fig = plt.figure(constrained_layout=True)

gs = GridSpec(3, 6, figure=fig)
ax5 = fig.add_subplot(gs[1, 3:6])
ax6 = fig.add_subplot(gs[2, :3])
ax7 = fig.add_subplot(gs[2, 3:6])

# Color map
cmap = plt.get_cmap('Greys_r')


# ax5
x = np.linspace(-1, 1, 100)
y = -x**2
ax5.set_ylim(-1.02, 0.3)
width_l = ax5.get_ylim()[1] - ax5.get_ylim()[0]
for t in np.linspace(0, 1, 40):
length =  -0.1*width_l*t
ax5.plot(*get_parallels(length=length), color=cmap(t/2 + 0.25))


# ax6
x = np.linspace(-3, 3, 100)
y = -(1/4*x**4 - 1.6*x**2)
ax6.plot(x, y)
ax6.set_xlim(ax6.get_xlim()[0]-0.5, ax6.get_xlim()[1]+0.5)
ax6.scatter(1/2*(ax6.get_xlim()[0] + ax6.get_xlim()[1]), 1.2, marker = 'o', s=900, facecolors='none')
lines = []
width_l = ax6.get_ylim()[1] - ax6.get_ylim()[0]
for t in np.linspace(0, 1, 40):
l, = ax6.plot(x, y - t * 0.1 * width_l, color=cmap(t/2 + 0.25))
lines.append(l)

def plot_rainbow(event=None):
x0 = x
y0 = y
for i in range(len(lines)):
    xx, yy = offset_curve(ax, x0, y0, -width_l)
    lines[i].set_data(xx, yy)
    lines[i].set_linewidth(1.1*width_l)
    x0 = xx
    y0 = yy

plot_rainbow()
fig.canvas.mpl_connect("resize_event", plot_rainbow)
fig.canvas.mpl_connect("button_release_event", plot_rainbow)

# ax7
x = np.linspace(-3, 3, 100)
y = 1/4*x**4 - 1.6*x**2
ax7.plot(x, y)
ax7.set_ylim(ax7.get_ylim()[0]-1.5, ax7.get_ylim()[1])
ax7.set_xlim(ax7.get_xlim()[0]-0.5, ax7.get_xlim()[1]+0.5)
ax7.scatter(1/2*(ax7.get_xlim()[0] + ax7.get_xlim()[1]), 1.2, marker = 'o', s=900, facecolors='none')
width_l = ax7.get_ylim()[1] - ax7.get_ylim()[0]
lines = []
for t in np.linspace(0, 1, 40):
l, = ax7.plot(x, y - t * 0.1 * width_l, color=cmap(t/2 + 0.25))
lines.append(l)


plot_rainbow()
fig.canvas.mpl_connect("resize_event", plot_rainbow)
fig.canvas.mpl_connect("button_release_event", plot_rainbow)

format_axes(fig)

# Save the figure (.pdf)
plt.tight_layout()
plt.savefig('fig.pdf')