Dear all,
Does anyone have similar experience that to make a colorbar
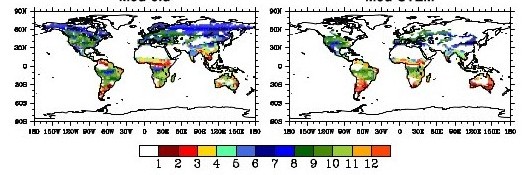
starting from a different color in the colormap? for example, to
denote the region with invalid data. I attahced a figure to show
what I would like to have, the withe region in the colorbar in the
attahced figure shows no data.
thanks a lot for any help,
best,
Chao
···
–
Chao YUE
Laboratoire des Sciences du Climat et de l’Environnement (LSCE-IPSL)
UMR 1572 CEA-CNRS-UVSQ
Batiment 712 - Pe 119
91191 GIF Sur YVETTE Cedex
Tel: (33) 01 69 08 29 02; Fax:01.69.08.77.16
One way I could think of is to make two contingent mat.axes.Axes,
with a smaller one setting as white backgroud, and the other bigger on
holding the colorbar. Is there some better way?
Chao
···
On Tue, Jul 2, 2013 at 12:12 PM, Chao YUE <chaoyuejoy@…287…> wrote:
Chao YUE
Laboratoire des Sciences du Climat et de l’Environnement (LSCE-IPSL)
UMR 1572 CEA-CNRS-UVSQ
Batiment 712 - Pe 119
91191 GIF Sur YVETTE Cedex
Tel: (33) 01 69 08 29 02; Fax:01.69.08.77.16
Dear all,
Does anyone have similar experience that to make a colorbar
starting from a different color in the colormap? for example, to
denote the region with invalid data. I attahced a figure to show
what I would like to have, the withe region in the colorbar in the
attahced figure shows no data.
thanks a lot for any help,
best,
Chao
–
–
Chao YUE
Laboratoire des Sciences du Climat et de l’Environnement (LSCE-IPSL)
UMR 1572 CEA-CNRS-UVSQ
Batiment 712 - Pe 119
91191 GIF Sur YVETTE Cedex
Tel: (33) 01 69 08 29 02; Fax:01.69.08.77.16
There is the “set_over” and “set_under” members of a colormap, and the plt.colorbar() function takes an “extend=‘min’” argument to add an extra color at the beginning of the colorbar. Setting “extendrect=True”, the added color will be rectangular instead of triangular.
Hopefully that helps.
Cheers,
Ben Root
···
On Tue, Jul 2, 2013 at 6:14 AM, Chao YUE <chaoyuejoy@…287…> wrote:
One way I could think of is to make two contingent mat.axes.Axes,
with a smaller one setting as white backgroud, and the other bigger on
holding the colorbar. Is there some better way?
Chao
On Tue, Jul 2, 2013 at 12:12 PM, Chao YUE <chaoyuejoy@…287…> wrote:
Chao YUE
Laboratoire des Sciences du Climat et de l’Environnement (LSCE-IPSL)
UMR 1572 CEA-CNRS-UVSQ
Batiment 712 - Pe 119
91191 GIF Sur YVETTE Cedex
Tel: (33) 01 69 08 29 02; Fax:01.69.08.77.16
Dear all,
Does anyone have similar experience that to make a colorbar
starting from a different color in the colormap? for example, to
denote the region with invalid data. I attahced a figure to show
what I would like to have, the withe region in the colorbar in the
attahced figure shows no data.
thanks a lot for any help,
best,
Chao
–
–
Chao YUE
Laboratoire des Sciences du Climat et de l’Environnement (LSCE-IPSL)
UMR 1572 CEA-CNRS-UVSQ
Batiment 712 - Pe 119
91191 GIF Sur YVETTE Cedex
Tel: (33) 01 69 08 29 02; Fax:01.69.08.77.16
This SF.net email is sponsored by Windows:
Build for Windows Store.
http://p.sf.net/sfu/windows-dev2dev
Matplotlib-users mailing list
Matplotlib-users@lists.sourceforge.net
https://lists.sourceforge.net/lists/listinfo/matplotlib-users
Thanks Ben. extendrect keyword is in mat 1.3, I didn’t try this but I tried set_under and extend=‘min’
with mat 1.2 and it works very nice.
cheers,
Chao
···
On Tue, Jul 2, 2013 at 6:14 AM, Chao YUE <[hidden email]> wrote:
One way I could think of is to make two contingent mat.axes.Axes,
with a smaller one setting as white backgroud, and the other bigger on
holding the colorbar. Is there some better way?
Chao
On Tue, Jul 2, 2013 at 12:12 PM, Chao YUE <[hidden email]> wrote:
Chao YUE
Laboratoire des Sciences du Climat et de l’Environnement (LSCE-IPSL)
UMR 1572 CEA-CNRS-UVSQ
Batiment 712 - Pe 119
91191 GIF Sur YVETTE Cedex
Tel: (33) 01 69 08 29 02; Fax:01.69.08.77.16
Dear all,
Does anyone have similar experience that to make a colorbar
starting from a different color in the colormap? for example, to
denote the region with invalid data. I attahced a figure to show
what I would like to have, the withe region in the colorbar in the
attahced figure shows no data.
thanks a lot for any help,
best,
Chao
–
–
Chao YUE
Laboratoire des Sciences du Climat et de l’Environnement (LSCE-IPSL)
UMR 1572 CEA-CNRS-UVSQ
Batiment 712 - Pe 119
91191 GIF Sur YVETTE Cedex
Tel: (33) 01 69 08 29 02; Fax:01.69.08.77.16
This SF.net email is sponsored by Windows:
Build for Windows Store.
http://p.sf.net/sfu/windows-dev2dev
Matplotlib-users mailing list
[hidden email]
https://lists.sourceforge.net/lists/listinfo/matplotlib-users