Hi,
I would like to know how to find out the extend of the actual image in a plot, in units of pixels.
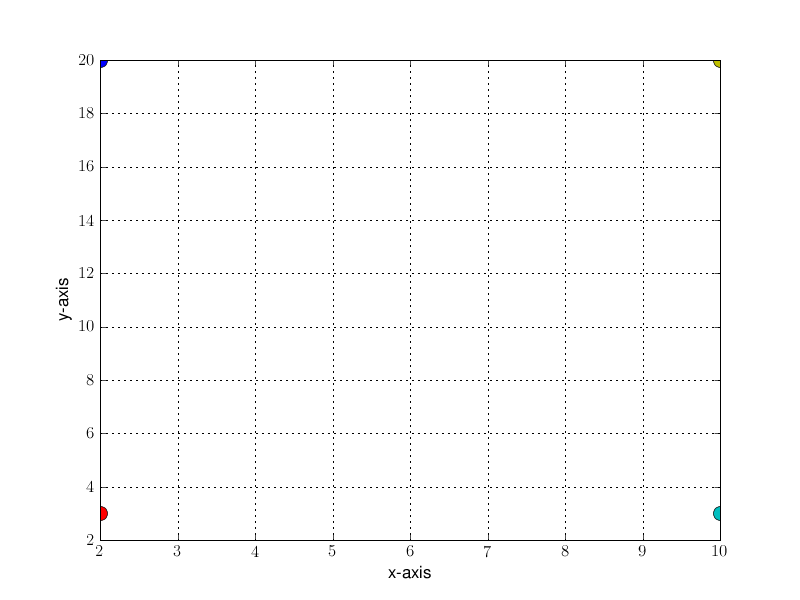
As example I have attached a plot which is essentially empty. The lower left corner is indicated by a red dot - what pixel position does this location have? When opening this image in e.g. kview it is easy to find out that this left corner of the actual plot corresponds to pixel (100,540). And so the upper right corner (the yellow dot) is (720,60).
But how do I find out these coordinates when generating such a plot with matplotlib? Are there some variables of the axis or the actual plot that contain these numbers?
Thanks
Alex
Take a look at the transformations tutorial.
http://matplotlib.sourceforge.net/users/transforms_tutorial.html
To convert from data -> pixel coordinates, use the axes transData transformation
In [1]: ax = gca()
In [2]: ax.transData.transform((0.5, 0.5))
Out[2]: array([ 333.125, 245. ])
You can also use mpl events to inspect the coordinates of the point
under the mouse
In [3]: fig = gcf()
In [4]: def on_click(event):
...: print event.x, event.y
...:
...:
In [5]: cid = fig.canvas.mpl_connect('button_press_event', on_click)
In [6]: 188 166.0
300 227.0
384 292.0
In [7]: fig.canvas.mpl_disconnect(cid)
See http://matplotlib.sourceforge.net/users/event_handling.html for more info.
JDH
···
On Wed, Sep 29, 2010 at 4:44 AM, Alexander Dietz <alexanderdietz1@...982...> wrote:
I would like to know how to find out the extend of the actual image in a
plot, in units of pixels.
As example I have attached a plot which is essentially empty. The lower left
corner is indicated by a red dot - what pixel position does this location
have? When opening this image in e.g. kview it is easy to find out that this
left corner of the actual plot corresponds to pixel (100,540). And so the
upper right corner (the yellow dot) is (720,60).
But how do I find out these coordinates when generating such a plot with
matplotlib? Are there some variables of the axis or the actual plot that
contain these numbers?
Hi John,
thanks for the reply, but I think your method is not working:
I would like to know how to find out the extend of the actual image in a
plot, in units of pixels.
As example I have attached a plot which is essentially empty. The lower left
corner is indicated by a red dot - what pixel position does this location
have? When opening this image in e.g. kview it is easy to find out that this
left corner of the actual plot corresponds to pixel (100,540). And so the
upper right corner (the yellow dot) is (720,60).
But how do I find out these coordinates when generating such a plot with
matplotlib? Are there some variables of the axis or the actual plot that
contain these numbers?
Take a look at the transformations tutorial.
http://matplotlib.sourceforge.net/users/transforms_tutorial.html
To convert from data → pixel coordinates, use the axes transData transformation
In [1]: ax = gca()
In [2]: ax.transData.transform((0.5, 0.5))
Out[2]: array([ 333.125, 245. ])
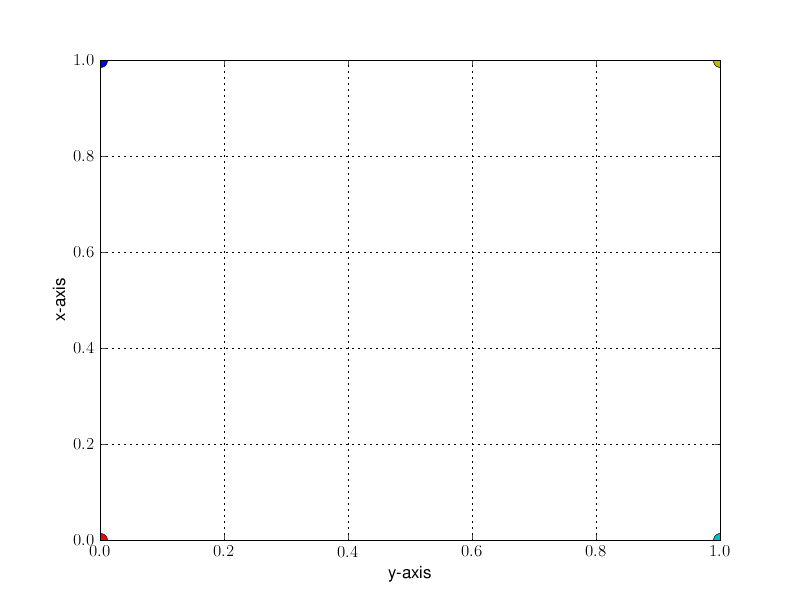
I have create a different plot (attached) and the point of the upper right corner (the yellow dot) is still at (720,60) as before. But with transData I get a completely wrong result:
print ax.transData.transform((10.0, 20.0))
[ 576. 432.]
Also the lower left points gets wrong coordinates. Maybe I am doing something stupidly wrong here?
Thanks
Alex
···
On Wed, Sep 29, 2010 at 15:39, John Hunter <jdh2358@…83…287…> wrote:
On Wed, Sep 29, 2010 at 4:44 AM, Alexander Dietz > > <alexanderdietz1@…982…> wrote:
You can also use mpl events to inspect the coordinates of the point
under the mouse
In [3]: fig = gcf()
In [4]: def on_click(event):
…: print event.x, event.y
…:
…:
In [5]: cid = fig.canvas.mpl_connect(‘button_press_event’, on_click)
In [6]: 188 166.0
300 227.0
384 292.0
In [7]: fig.canvas.mpl_disconnect(cid)
See http://matplotlib.sourceforge.net/users/event_handling.html for more info.
JDH
Why do you say it's wrong? Note that in mpl, (0,0) is (bottom left),
not (upper,left). So this is saying that the yellow dot at 10,20
(data coords) is 576 pixels up from the bottom and 432 pixels over
from the left.
JDH
···
On Wed, Sep 29, 2010 at 8:50 AM, Alexander Dietz <Alexander.Dietz72@...982...> wrote:
print ax.transData.transform((10.0, 20.0))
[ 576. 432.]
Hi,
print ax.transData.transform((10.0, 20.0))
[ 576. 432.]
Why do you say it’s wrong? Note that in mpl, (0,0) is (bottom left),
not (upper,left). So this is saying that the yellow dot at 10,20
(data coords) is 576 pixels up from the bottom and 432 pixels over
from the left.
ok maybe it is. But then I need the size of the entire figure written to a file. How can I find out the pixel-size of the entire figure, inclusive every title, axis, labels…
Thanks
Alex
···
On Wed, Sep 29, 2010 at 16:00, John Hunter <jdh2358@…878…287…> wrote:
On Wed, Sep 29, 2010 at 8:50 AM, Alexander Dietz > > <Alexander.Dietz72@…3300…> wrote:
JDH
If you’re just looking for the dimensions of the overall figure in pixels, you can easily access them through other means. E.g:
import matplotlib.pyplot as plt
fig = plt.figure()
_, _, width, height = fig.bbox.extents # ← Extent of the figure in pixels
fig.savefig(‘temp.png’, dpi=fig.dpi) # ← Be sure to specify the dpi!!
Note that you’ll have to specify that you want to save the figure at the same DPI it was when you called the extents…
The figure will be saved with whatever default DPI is in your .matplotlibrc, which is commonly different than the default screen dpi (80).
Hope that helps,
-Joe
···
On Wed, Sep 29, 2010 at 9:44 AM, Alexander Dietz <alexanderdietz1@…982…> wrote:
Hi,
On Wed, Sep 29, 2010 at 16:00, John Hunter <jdh2358@…287…> wrote:
On Wed, Sep 29, 2010 at 8:50 AM, Alexander Dietz > > > > <Alexander.Dietz72@…982…> wrote:
print ax.transData.transform((10.0, 20.0))
[ 576. 432.]
Why do you say it’s wrong? Note that in mpl, (0,0) is (bottom left),
not (upper,left). So this is saying that the yellow dot at 10,20
(data coords) is 576 pixels up from the bottom and 432 pixels over
from the left.
ok maybe it is. But then I need the size of the entire figure written to a file. How can I find out the pixel-size of the entire figure, inclusive every title, axis, labels…
Thanks
Alex
JDH
Start uncovering the many advantages of virtual appliances
and start using them to simplify application deployment and
accelerate your shift to cloud computing.
http://p.sf.net/sfu/novell-sfdev2dev
Matplotlib-users mailing list
Matplotlib-users@lists.sourceforge.net
https://lists.sourceforge.net/lists/listinfo/matplotlib-users
Hi,
print ax.transData.transform((10.0, 20.0))
[ 576. 432.]
Why do you say it’s wrong? Note that in mpl, (0,0) is (bottom left),
not (upper,left). So this is saying that the yellow dot at 10,20
(data coords) is 576 pixels up from the bottom and 432 pixels over
from the left.
This is not correct, either. Since the total width of the image is 800 pixels and the total height is 600 pixels, I get the following coordinates of the yellow dot:
x-coord: = 432
y-coord = 600-576 = 24
but in fact, the position of the yellow dot is still at (720, 60)!. (And even if you swapped x and y coordinates it will never be correct.).
So anyone another idea how to transform a data-point (10,20) to the image coordinates?
Cheers
Alex
···
On Wed, Sep 29, 2010 at 16:00, John Hunter <jdh2358@…878…287…> wrote:
On Wed, Sep 29, 2010 at 8:50 AM, Alexander Dietz > > <Alexander.Dietz72@…3300…> wrote:
JDH
Alex,
I don’t think it is technically possible. Keep in mind that the coordinate system that is used to display figures is merely a convention used by matplotlib and the GUI system. It is not the same transformation that is used when saving images, and nor should it be because of differences between the resolution of your display and the resolution of your image (typically unknown until save time).
In addition to that issue is the figure window itself. In particular, the toolbar is also a part of the same display coordinate system. I would also wonder if there might be some horizontal padding going on that is throwing off the x-coordinates.
Ben Root
···
On Thu, Sep 30, 2010 at 3:28 AM, Alexander Dietz <alexanderdietz1@…982…> wrote:
Hi,
On Wed, Sep 29, 2010 at 16:00, John Hunter <jdh2358@…287…> wrote:
On Wed, Sep 29, 2010 at 8:50 AM, Alexander Dietz > > > > <Alexander.Dietz72@…982…> wrote:
print ax.transData.transform((10.0, 20.0))
[ 576. 432.]
Why do you say it’s wrong? Note that in mpl, (0,0) is (bottom left),
not (upper,left). So this is saying that the yellow dot at 10,20
(data coords) is 576 pixels up from the bottom and 432 pixels over
from the left.
This is not correct, either. Since the total width of the image is 800 pixels and the total height is 600 pixels, I get the following coordinates of the yellow dot:
x-coord: = 432
y-coord = 600-576 = 24
but in fact, the position of the yellow dot is still at (720, 60)!. (And even if you swapped x and y coordinates it will never be correct.).
So anyone another idea how to transform a data-point (10,20) to the image coordinates?
Cheers
Alex