How can I draw lines that are shaded or hashed on one sides, the type of line that is used for boundaries on maps.
Here is an example:
How can I draw lines that are shaded or hashed on one sides, the type of line that is used for boundaries on maps.
Here is an example:
Welcome,
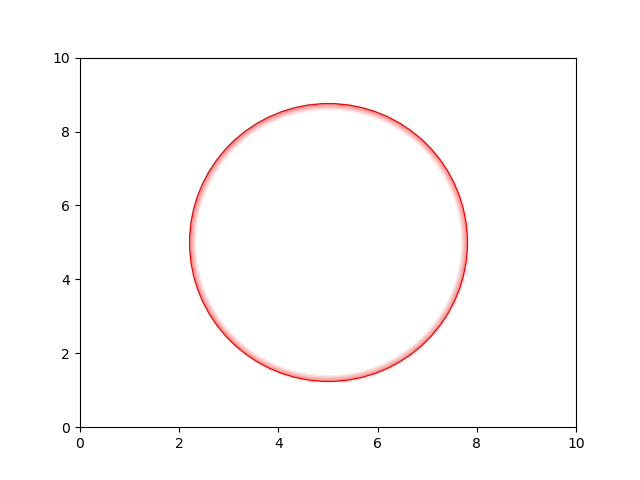
There are lot of ways, here is a blunt one :
import matplotlib.pyplot as plt

# Main plot
plt.plot( 5, 5, c ='None', marker = 'o', markersize = 200, markeredgecolor = 'red',
          markeredgewidth = 1, alpha=1)

# Shade - In a small loop decreases the size and the alpha

for m in range(1,6):
    plt.plot( 5, 5, c ='None', marker = 'o', markersize = 200-m*2, markeredgecolor = 'red',
              markeredgewidth = 1, alpha=0.5-m/10)

plt.ylim(0,10)
plt.xlim(0,10)

plt.show()
Gives you :
Hi @El_Uatu, thank you very much for your suggestion!
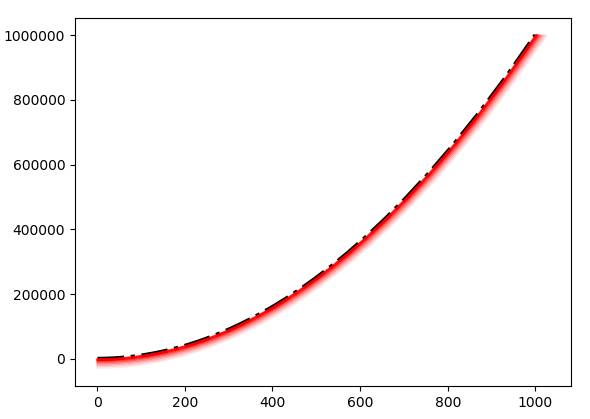
I found a library that can calculate offset lines and switched to axis coordinates so that it works independent of the aspect ratio.
There are many corner cases, and the parallel_offset function might return a list of separate offsets, but for this simple case it looks very good.
import matplotlib.pyplot as plt
import numpy as np
from shapely.geometry import LineString

x=np.logspace(0,3,100)
y=x**2

fig, ax = plt.subplots()
p=ax.plot(x,y, color='k', linestyle='dashdot', linewidth=3)
pth = p[0].get_path()
# go to axes coordinates
X, Y = ax.transLimits.transform_path(pth).vertices.T

l=LineString(zip(X,Y))

for offset in np.linspace(0.2,1,10):
    # parallel_offset(distance, side, resolution=16, join_style=1, mitre_limit=5.0)
    # resolution = # of segments to approximate a quarter circle
    offsetScaling = 0.005
    l2=l.parallel_offset(offset*offsetScaling, side='right')
    x2, y2 = np.array(l2.coords).T
    # back to data coordinates
    xo, yo = ax.transLimits.inverted().transform(np.vstack((x2,y2)).T).T
    ax.plot(xo, yo, alpha=1-offset, color='red')
Thank you!
You welcome !!!
Seems to be a useful lib you have found - did not know it at all - thanks for mentioning.
Rgds
Version 3.4 will include this pull request which will produce plots like the attached.
Here are some of the examples for the dev version…
Great! Exactly my application. Thanks!
/2016sb50tfr-56ae841c5f9b58b7d010ca78.jpg)
