I have the following code:
import numpy as np
import skfuzzy.control as ctrl
universe = np.linspace(-2, 2, 5)
error = ctrl.Antecedent(universe, 'error')
delta = ctrl.Antecedent(universe, 'delta')
output = ctrl.Consequent(universe, 'output')
names = ['nb', 'ns', 'ze', 'ps', 'pb']
error.automf(names=names)
delta.automf(names=names)
output.automf(names=names)
rule0 = ctrl.Rule(antecedent=((error['nb'] & delta['nb']) |
(error['ns'] & delta['nb']) |
(error['nb'] & delta['ns'])),
consequent=output['nb'], label='rule nb')
rule1 = ctrl.Rule(antecedent=((error['nb'] & delta['ze']) |
(error['nb'] & delta['ps']) |
(error['ns'] & delta['ns']) |
(error['ns'] & delta['ze']) |
(error['ze'] & delta['ns']) |
(error['ze'] & delta['nb']) |
(error['ps'] & delta['nb'])),
consequent=output['ns'], label='rule ns')
rule2 = ctrl.Rule(antecedent=((error['nb'] & delta['pb']) |
(error['ns'] & delta['ps']) |
(error['ze'] & delta['ze']) |
(error['ps'] & delta['ns']) |
(error['pb'] & delta['nb'])),
consequent=output['ze'], label='rule ze')
rule3 = ctrl.Rule(antecedent=((error['ns'] & delta['pb']) |
(error['ze'] & delta['pb']) |
(error['ze'] & delta['ps']) |
(error['ps'] & delta['ps']) |
(error['ps'] & delta['ze']) |
(error['pb'] & delta['ze']) |
(error['pb'] & delta['ns'])),
consequent=output['ps'], label='rule ps')
rule4 = ctrl.Rule(antecedent=((error['ps'] & delta['pb']) |
(error['pb'] & delta['pb']) |
(error['pb'] & delta['ps'])),
consequent=output['pb'], label='rule pb')
system = ctrl.ControlSystem(rules=[rule0, rule1, rule2, rule3, rule4])
sim = ctrl.ControlSystemSimulation(system, flush_after_run=21 * 21 + 1)
upsampled = np.linspace(-2, 2, 21)
x, y = np.meshgrid(upsampled, upsampled)
z = np.zeros_like(x)
for i in range(21):
for j in range(21):
sim.input['error'] = x[i, j]
sim.input['delta'] = y[i, j]
sim.compute()
z[i, j] = sim.output['output']
import matplotlib.pyplot as plt
from mpl_toolkits.mplot3d import Axes3D # Required for 3D plotting
fig = plt.figure(figsize=(8, 8))
ax = fig.add_subplot(111, projection='3d')
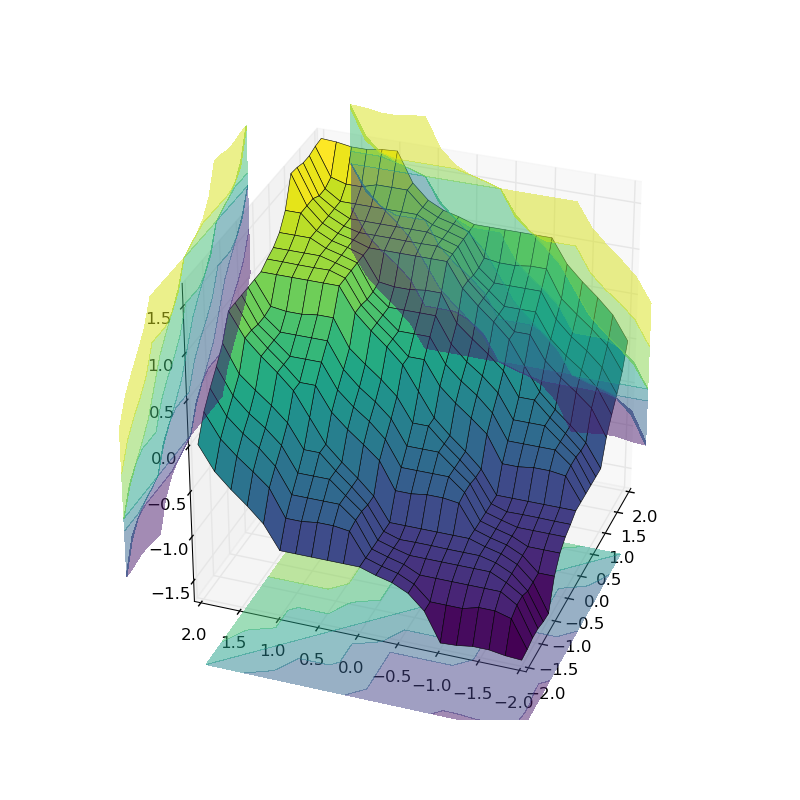
surf = ax.plot_surface(x, y, z, rstride=1, cstride=1, cmap='viridis',
linewidth=0.4, antialiased=True)
cset = ax.contourf(x, y, z, zdir='z', offset=-2.5, cmap='viridis', alpha=0.5)
cset = ax.contourf(x, y, z, zdir='x', offset=3, cmap='viridis', alpha=0.5)
cset = ax.contourf(x, y, z, zdir='y', offset=3, cmap='viridis', alpha=0.5)
ax.view_init(30, 200)
I expect after the last line ax.view_init() show the image of diagram but nothing happend.
I do not know python at all so every help could be helpful  .
.