Thanks. That could be a very useful observation. I'm doing most of this on a win7 machine. When I installed MPL, I had two small dialogs appear that said something was missing, but I pressed on. MPL seemed to generally work except for the show() problem. I'm in the process of bringing programs from my XP to the win7 machine, and on the XP machine I decided to start using MPL with a 900 line Py program that I'm revising. I had gotten stuck with the very same problem there. However, last night I realized someone had added a MPL plot to it years ago, and it does not fail on show().
I noticed the msgs mentioned, and though I mad made a mistake in not installing numpy first, so tried to figure out a way to do it. Three posts on different forums did not provide an answer. I accidentally founnd the author of MPL's hidden away in one of MPL files. He said it didn't make a difference and asked me not to use his address. I though the warning msgs might be of interest to him, so wrote to him. He had blocked me. Perhaps I need to file a bug report to get his attention on that.
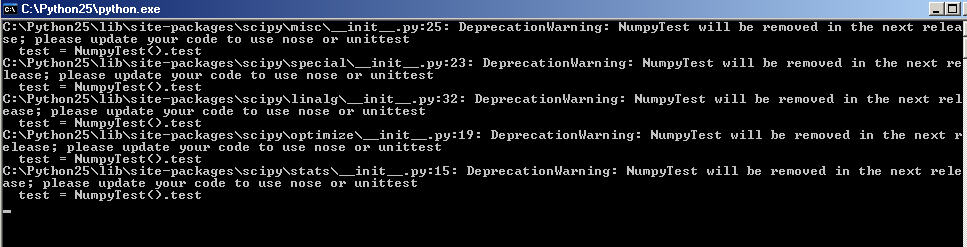
Anyway, I'm now stalled on the development of the big program. It's possible this is an IDLE problem, but I ran the big program with a click on the file, and the black window showed the same problem. It did show some other warnings, which I think I'll capture with Snagit. This is all on XP Pro.
I'm going to copy the two code segments here. Maybe you can see a difference. I'll also attach the capture of the window too. Two jpg files are attached for the same code below, and one for the error messages from the console XP.
=================OLD working code============
def light_curve( self ):
result =
test = 1
for tup in self.subimages:
left,top,subimage = tup
total = 0
avg_total = 0
if (test == 1):
box = (left, top, left+128, top+128)
region = self.reference_image.crop(box)
self.reference_image.paste(subimage, box)
test = 2
else:
for x in range(left+43,left+82):
for y in range(top+43, top+82):
avg_total = avg_total + self.reference_image.getpixel((x, y))
for x in range(43,82): #take the center 40 X 40 pixel block
for y in range(43,82):
v = subimage.getpixel((x, y))
total = total + v
#for x in range(left, left+127):
# for y in range(top, top+127):
# avg_total = avg_total + self.reference_image.getpixel((x, y))
#for x in range(0, 127):
# for y in range(0, 127):
# total = total + subimage.getpixel((x, y))
result.append(total - avg_total) #(average - background average) gives pixel intensity above the background)
plotting_x = range(2, len(result)+2)
plot(plotting_x, result)
xlabel('Frame #')
ylabel('Pixel count above background count')
title('Light curve for selected subplot')
show()
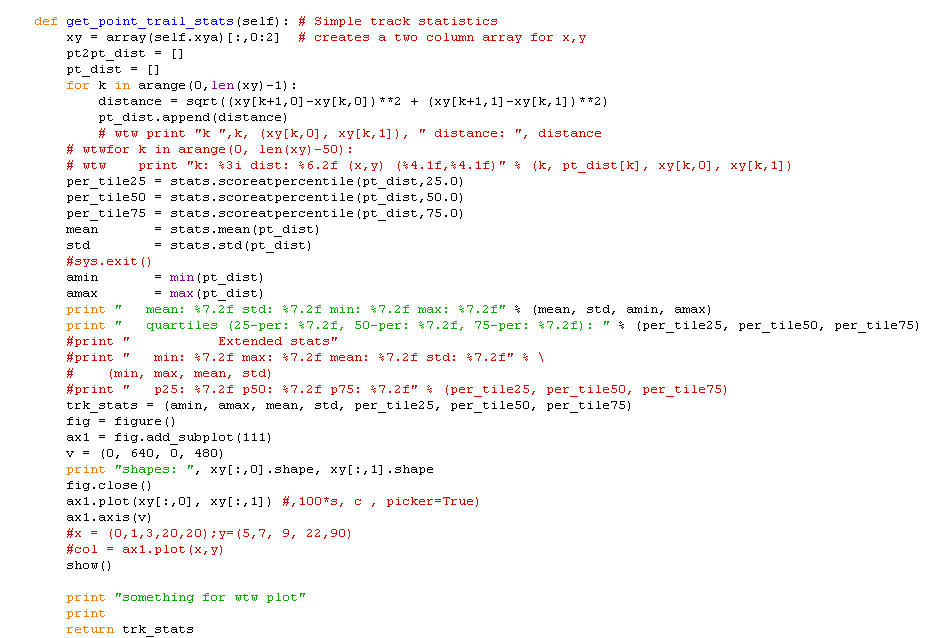
===========New Code with show problem
def get_point_trail_stats(self): # Simple track statistics
xy = array(self.xya)[:,0:2] # creates a two column array for x,y
pt2pt_dist =
pt_dist =
for k in arange(0,len(xy)-1):
distance = sqrt((xy[k+1,0]-xy[k,0])**2 + (xy[k+1,1]-xy[k,1])**2)
pt_dist.append(distance)
# wtw print "k ",k, (xy[k,0], xy[k,1]), " distance: ", distance
# wtwfor k in arange(0, len(xy)-50):
# wtw print "k: %3i dist: %6.2f (x,y) (%4.1f,%4.1f)" % (k, pt_dist[k], xy[k,0], xy[k,1])
per_tile25 = stats.scoreatpercentile(pt_dist,25.0)
per_tile50 = stats.scoreatpercentile(pt_dist,50.0)
per_tile75 = stats.scoreatpercentile(pt_dist,75.0)
mean = stats.mean(pt_dist)
std = stats.std(pt_dist)
#sys.exit()
amin = min(pt_dist)
amax = max(pt_dist)
print " mean: %7.2f std: %7.2f min: %7.2f max: %7.2f" % (mean, std, amin, amax)
print " quartiles (25-per: %7.2f, 50-per: %7.2f, 75-per: %7.2f): " % (per_tile25, per_tile50, per_tile75)
#print " Extended stats"
#print " min: %7.2f max: %7.2f mean: %7.2f std: %7.2f" % \
# (min, max, mean, std)
#print " p25: %7.2f p50: %7.2f p75: %7.2f" % (per_tile25, per_tile50, per_tile75)
trk_stats = (amin, amax, mean, std, per_tile25, per_tile50, per_tile75)
fig = figure()
ax1 = fig.add_subplot(111)
v = (0, 640, 0, 480)
print "shapes: ", xy[:,0].shape, xy[:,1].shape
fig.close()
ax1.plot(xy[:,0], xy[:,1]) #,100*s, c , picker=True)
ax1.axis(v)
#x = (0,1,3,20,20);y=(5,7, 9, 22,90)
#col = ax1.plot(x,y)
show()
print "something for wtw plot"
print
return trk_stats
···
On 2/7/2010 10:53 PM, Philipp Bender wrote:
I'm pretty sure your problem is not generally related to matplotlib, all the
examples you mentioned and the one you sent me by e-mail worked for me. Maybe
you try a different version or a different operating system for your scripts.
------------------------------------------------------------------------------
The Planet: dedicated and managed hosting, cloud storage, colocation
Stay online with enterprise data centers and the best network in the business
Choose flexible plans and management services without long-term contracts
Personal 24x7 support from experience hosting pros just a phone call away.
http://p.sf.net/sfu/theplanet-com
_______________________________________________
Matplotlib-users mailing list
Matplotlib-users@lists.sourceforge.net
matplotlib-users List Signup and Options
--
"Crime is way down. War is declining. And that's far from the good news." -- Steven Pinker (and other sources) Why is this true, but yet the media says otherwise? The media knows very well how to manipulate us (see limbic, emotion). -- WTW