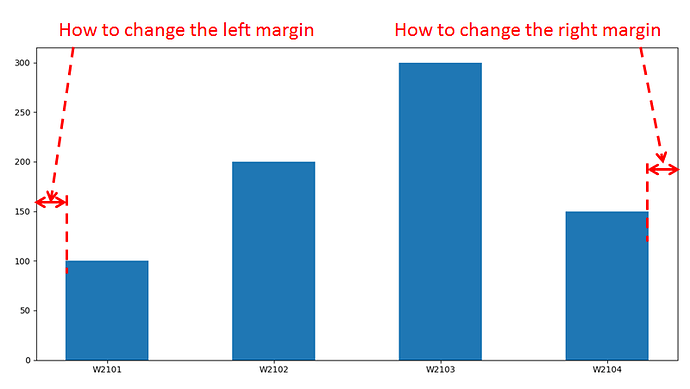
My code is below:
import pandas as pd
import matplotlib.pyplot as plt
df=pd.DataFrame({‘WEEK’:[‘W2101’,‘W2102’,‘W2103’,‘W2104’],‘COUNT’:[100,200,300,150]})
fig, ax = plt.subplots()
plt.bar(df.WEEK,df.COUNT,width=0.5)
plt.show()
plt.close(‘all’)
How to make the change shown in the attached picture?
Thanks
