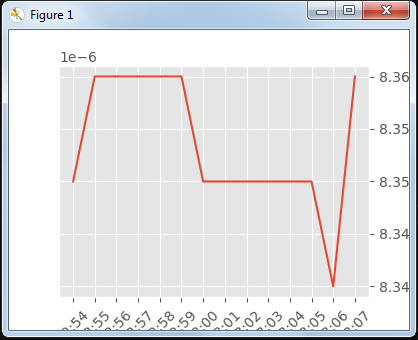
I’m trying to align the chart to the top and left side of the window, eleminating all the whitespace there. Also the labels on the x axis are cut-off for some reason, even though I’m using tight_layout(). On top of this I have trouble removing the scientific notation from the y axis. (I want to display the original str or float held in the variable, If I use plt.yaxis.set_major_formatter(ScalarFormatter(useOffset=False)) I get an attribute arror: ‘matplotlib.pyplot’ has no attribute ‘yaxis’. This is what it looks like:
from binance.client import Client
import time, os, csv, datetime
import matplotlib.pyplot as plt
import matplotlib.animation as animation
import matplotlib as mpl
from matplotlib.ticker import ScalarFormatter

client = Client(apikey, apisecret)

mpl.rcParams['toolbar'] = 'None'
fig = plt.figure(figsize=(4,3))
plt.style.use('ggplot')
plt.rcParams['ytick.right'] = plt.rcParams['ytick.labelright'] = True
plt.rcParams['ytick.left'] = plt.rcParams['ytick.labelleft'] = False

x_vars = []
y_vars = []

def animate(i):
    global x_vars
    global y_vars
    if len(x_vars) > 30:
        x_vars = x_vars[-30:]
        y_vars = y_vars[-30:]
    else:
        pass

    current_time = client.get_server_time()
    current_price = client.get_symbol_ticker(symbol="XRPBTC")

    trstime = current_time["serverTime"] / 1000
    time = datetime.datetime.fromtimestamp(int(trstime)).strftime('%M:%S')

    x_vars.append(str(time))
    y_vars.append(float(current_price["price"]))

    plt.cla()
    plt.plot(x_vars, y_vars)
    plt.xticks(rotation = 45)


ani = animation.FuncAnimation(fig, animate, interval=500)
plt.tight_layout()
plt.show()