I was afraid I'd have to do that. Do you have some
> fairly simple sample code, that would help some.
What you want to do is use a line collection, see
http://matplotlib.sf.net/matplotlib.collections.py. You can specify a
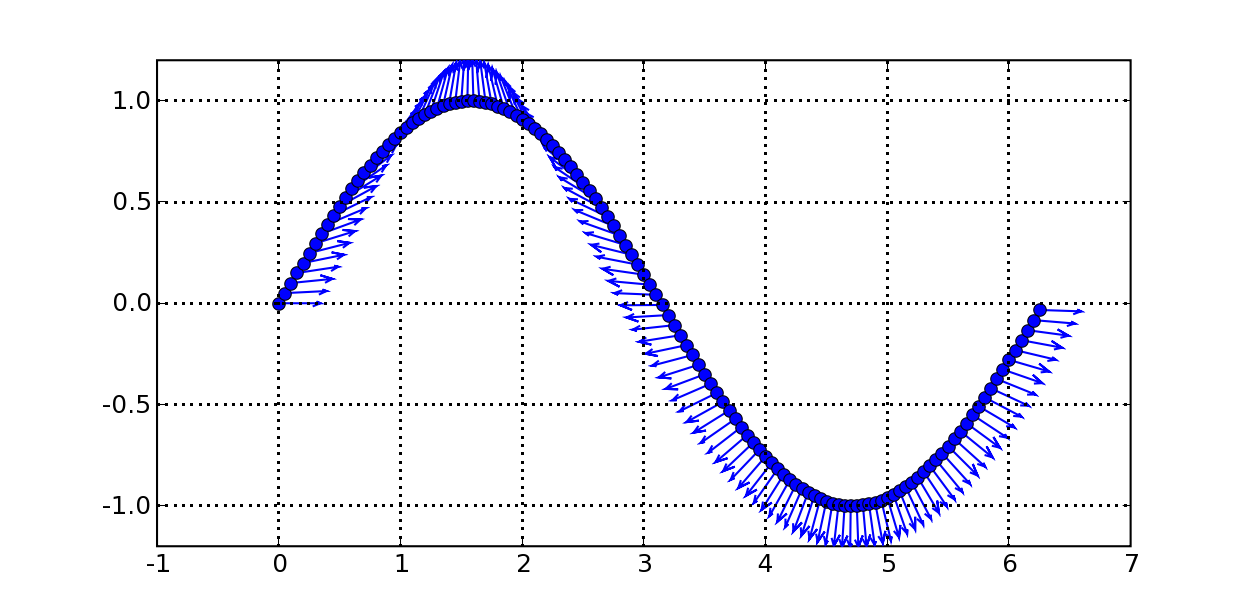
list of line segments which can be in one coordinate system (eg
oriented lines with origin at 0 and lengths in points) and pass the
collection a list off offsets which can be in another coordinate
system (eg the locations of the lines in data coordinates). This is
just the kinds of thing that is useful for a vector field, where you
want oriented lines at x,y coords in data coords but lengths and
orientation of the lines in some physical coordinate system.
Here is a little example -- you'll also want to read up on mpl
transforms at http://matplotlib.sf.net/matplotlib.transforms.html
from matplotlib.transforms import scale_transform, Value
from matplotlib.collections import LineCollection
from pylab import figure, show
import matplotlib.numerix as nx
N = 100
angles = nx.mlab.rand(N)*2*nx.pi
radii = nx.mlab.rand(N)*144. # max line should be 2 inches long
segments = [((0,0), (r*nx.cos(theta), r*nx.sin(theta))) for r,theta in zip(radii, angles)]
offsets = zip(10*nx.mlab.rand(N),20*nx.mlab.randn(N))
fig = figure()
ax = fig.add_subplot(111)
coll = LineCollection(segments, offsets=offsets,
transOffset=ax.transData, # transforms the x,y offsets
)
# points/72.*dpi = pixels -- see matplotlib.transforms
trans = scale_transform(fig.dpi/Value(72.), fig.dpi/Value(72.))
coll.set_transform(trans) # the points to pixels transform
ax.add_collection(coll)
ax.set_xlim(0,10)
ax.set_ylim(0,20)
show()