Hi all,
This is a re-post, which I don't' ordinarily do, but I got not a single reply, so I wonder if it never actually got posted.
I'm trying to figure out how to draw something in pixel or "real"
units(inches, mm, etc). what I want is to be able to place an object
according to axes units, but not have it change size as I zoom in and
out, kind of like a marker.
The big picture:
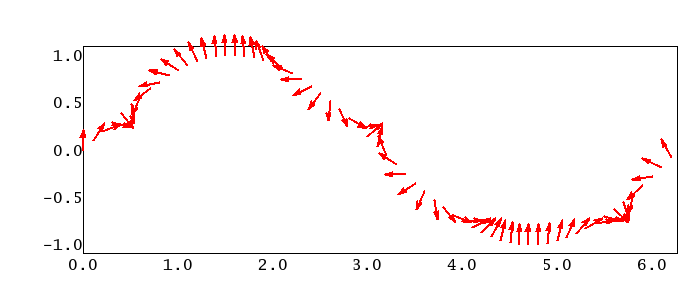
I'm trying to make a plot that shows a vector value over time (in this
case ocean current velocity and direction). The x axis is time, the y
axis is magnitude, and at each point I want to draw an arrow pointing in
the direction of the vector at that time. However, I don't want the size
(or angle) of that arrow to change as you zoom in and out.
Any ideas how I can accomplish this?
See the enclosed PNG for an example with fake data.
-Chris
···
--
Christopher Barker, Ph.D.
Oceanographer
NOAA/OR&R/HAZMAT (206) 526-6959 voice
7600 Sand Point Way NE (206) 526-6329 fax
Seattle, WA 98115 (206) 526-6317 main reception
Chris.Barker@...259...
--
Christopher Barker, Ph.D.
Oceanographer
NOAA/OR&R/HAZMAT (206) 526-6959 voice
7600 Sand Point Way NE (206) 526-6329 fax
Seattle, WA 98115 (206) 526-6317 main reception
Chris.Barker@...259...
Chris,
Your previous post did get through. This is something that I will need also, and I would like to look into it, but I haven't been able to find the time yet. I have worked on this sort of thing in Matlab--I added the vector-plotting capability (m_vec) to Rich Pawlowicz's m_map package. (I realize that what you are talking about is a little bit different from what m_vec does, but it requires the same type of control over how plotting is done.) My guess is that in the long run it will be possible to do it much more easily and directly in mpl than in Matlab, but this may require some modifications or additions to mpl internals.
Eric
Christopher Barker wrote:
···
Hi all,
This is a re-post, which I don't' ordinarily do, but I got not a single reply, so I wonder if it never actually got posted.
I'm trying to figure out how to draw something in pixel or "real"
units(inches, mm, etc). what I want is to be able to place an object
according to axes units, but not have it change size as I zoom in and
out, kind of like a marker.
The big picture:
I'm trying to make a plot that shows a vector value over time (in this
case ocean current velocity and direction). The x axis is time, the y
axis is magnitude, and at each point I want to draw an arrow pointing in
the direction of the vector at that time. However, I don't want the size
(or angle) of that arrow to change as you zoom in and out.
Any ideas how I can accomplish this?
See the enclosed PNG for an example with fake data.
-Chris
------------------------------------------------------------------------