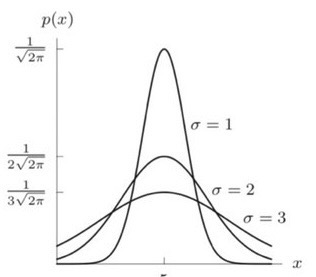
I’m looking for the solution to plot this on matplotlib for my math lecture. Something like writing the mathematical expressions on y axis in this figure. Thanks and regards (apologize for my bad grammar)
1 Like
I think you can do this with a combination of
-
ax.plot+ numpy to compute discrete versions of the functions - configuring the Axes spines Dropped spines — Matplotlib 3.5.1 documentation
- Text rendering with LaTeX — Matplotlib 3.5.1 documentation for the type setting
- Annotations — Matplotlib 3.5.1 documentation for the floating σ labels
-
ax.set_xticks,ax.set_yticksfor the
x/y ticks matplotlib.axes.Axes.set_xticks — Matplotlib 3.5.1 documentation
2 Likes