Dear all matplotlib/basemap users,
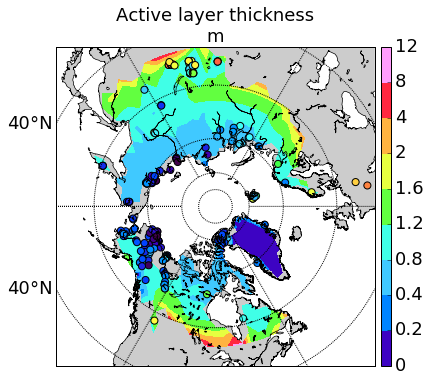
I have made a plot like below using matplotib and basemap. The problem is that I wan to add also parallel ticklabels for the circles higher than 40N. Anybody knows how to achieve this? I checked the yticklabels for the map axes but find it’s not implemented as an original polar plot in matplotlib. Thanks a lot in advance!
···
please visit:
http://www.globalcarbonatlas.org/
Chao YUE
postdoc at LSCE
CEA-Ormes des Merisiers, F-91191 GIF-SUR-YVETTE CEDEX
Tel: 33 1 69 08 41 87