Hello all,
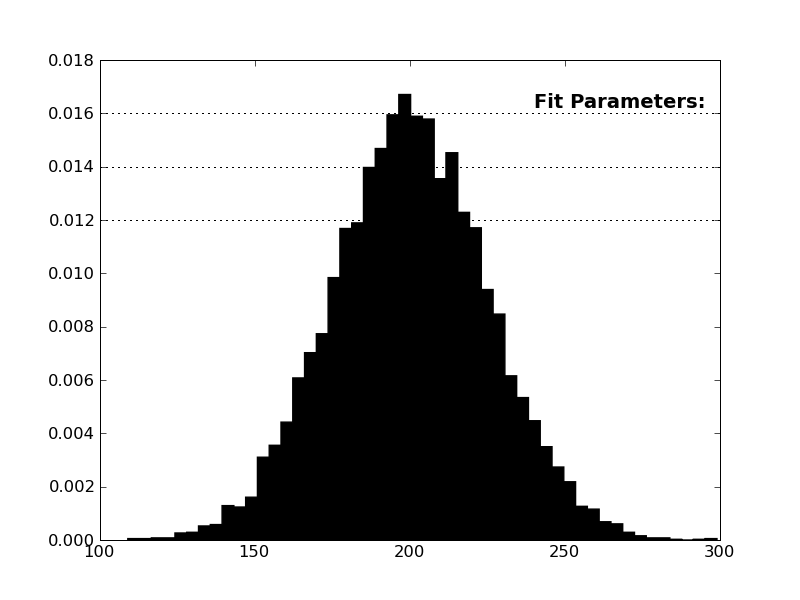
I suppose this is a newbie question, but why do I get these three horizontal grid lines when I add text to my plot? I’ve tried repeating the call to pyplot.grid() but that doesn’t affect anything…
#!/usr/bin/env python
from matplotlib import pyplot
from scipy import randn
mu, sigma = 200, 25
x = mu + sigma*randn(10000)
pyplot.grid(False)
n, bins, patches = pyplot.hist(x, 50, normed=1, histtype=‘stepfilled’)
xlim_right = pyplot.xlim()[1]
ylim_top = pyplot.ylim()[1]
pyplot.text(xlim_right0.8, ylim_top0.9, ‘Fit Parameters:’, weight=‘bold’, size=‘large’)
pyplot.show()
#end script
My matplotlib version is:
[craigb@…2742… matplotlib]$ python
Python 2.6.2 (r262:71600, Jul 28 2009, 10:47:31)
[GCC 4.1.2 20080704 (Red Hat 4.1.2-44)] on linux2
Type “help”, “copyright”, “credits” or “license” for more information.
import matplotlib
matplotlib.version
‘0.98.5.2’
Thanks in advance!
I can’t reproduce this with SVN head here. I don’t see anything in your script that should cause this. Can you upgrade to the latest release, 0.99?
Ryan
···
On Thu, Aug 20, 2009 at 11:00 AM, DEMOLISHOR! the Demolishor <destroooooy@…287…> wrote:
Hello all,
I suppose this is a newbie question, but why do I get these three horizontal grid lines when I add text to my plot? I’ve tried repeating the call to pyplot.grid() but that doesn’t affect anything…
#!/usr/bin/env python
from matplotlib import pyplot
from scipy import randn
mu, sigma = 200, 25
x = mu + sigma*randn(10000)
pyplot.grid(False)
n, bins, patches = pyplot.hist(x, 50, normed=1, histtype=‘stepfilled’)
xlim_right = pyplot.xlim()[1]
ylim_top = pyplot.ylim()[1]
pyplot.text(xlim_right0.8, ylim_top0.9, ‘Fit Parameters:’, weight=‘bold’, size=‘large’)
pyplot.show()
#end script
My matplotlib version is:
[craigb@…2742… matplotlib]$ python
Python 2.6.2 (r262:71600, Jul 28 2009, 10:47:31)
[GCC 4.1.2 20080704 (Red Hat 4.1.2-44)] on linux2
Type “help”, “copyright”, “credits” or “license” for more information.
import matplotlib
matplotlib.version
‘0.98.5.2’
–
Ryan May
Graduate Research Assistant
School of Meteorology
University of Oklahoma
Sent from Pasadena, California, United States