I have two datasets whose each observation represents a travel time of a vehicle from one place to another in a given network.
I am trying to plot a histogram for each dataset in the same plot. However, the result does not look good:
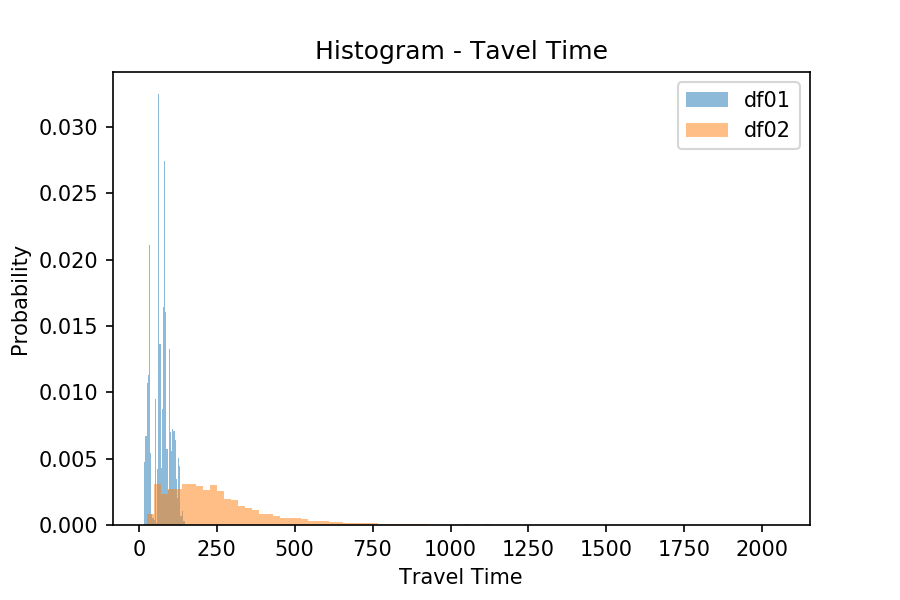
Any thoughts on how I could improve it?
Thanks in advance!