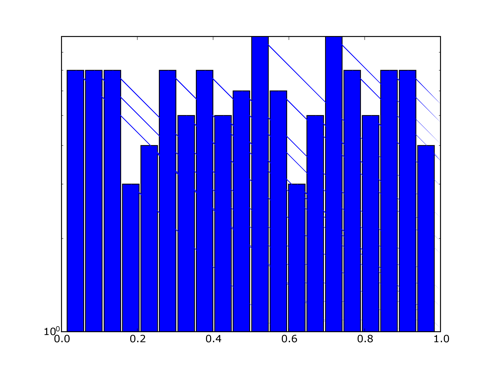
The following minimal script reveals a rendering problem with displaying a histogram on a log vertical axis.
I'm using matplotlib0.87.4 in WinXP with python 2.3.5 Enthon.
from pylab import *
hist(rand(100), 20, bottom=1)
setp(gca(), yscale="log")
show()
Gary R.
Note: I just verified that this was introduced into 0.87.4.
0.87.3 doesn't exhibit the problem. See attachment.
Gary R.
gruben@...636... wrote:
···
The following minimal script reveals a rendering problem with displaying a histogram on a log vertical axis.
I'm using matplotlib0.87.4 in WinXP with python 2.3.5 Enthon.
from pylab import *
hist(rand(100), 20, bottom=1)
setp(gca(), yscale="log")
show()
Gary R.
More information on this bug: on my WinXP laptop, it seems to only manifest under some circumstances. When running the script from inside SciTE or ipython, it seems more or less repeatable (sometimes it won't show on the first run but does from then on), but if the .py file is run directly from the windows explorer, it doesn't show up. On my win98 desktop, however, it shows up regardless.
Gary Ruben wrote:
···
Note: I just verified that this was introduced into 0.87.4.
0.87.3 doesn't exhibit the problem. See attachment.
Gary R.
gruben@...636... wrote:
The following minimal script reveals a rendering problem with displaying a histogram on a log vertical axis.
I'm using matplotlib0.87.4 in WinXP with python 2.3.5 Enthon.
from pylab import *
hist(rand(100), 20, bottom=1)
setp(gca(), yscale="log")
show()
Gary R.
>> The following minimal script reveals a rendering problem with
>> displaying a histogram on a log vertical axis.
Has this been resolved yet? I'm running Matplotlib 0.87.5-2.2 on
Debian Unstable. I try to run the following script:
from pylab import *
hist(rand(100), 20)
ax = gca()
ax.set_yscale('log')
show()
And get the error:
Traceback (most recent call last):
File "/usr/lib/python2.4/site-packages/matplotlib/backends/backend_gtk.py",
line 284, in expose_event
self._render_figure(self._pixmap, w, h)
File "/usr/lib/python2.4/site-packages/matplotlib/backends/backend_gtkagg.py",
line 73, in _render_figure
FigureCanvasAgg.draw(self)
File "/usr/lib/python2.4/site-packages/matplotlib/backends/backend_agg.py",
line 391, in draw
self.figure.draw(renderer)
File "/usr/lib/python2.4/site-packages/matplotlib/figure.py", line
538, in draw
for a in self.axes: a.draw(renderer)
File "/usr/lib/python2.4/site-packages/matplotlib/axes.py", line 1057, in draw
a.draw(renderer)
File "/usr/lib/python2.4/site-packages/matplotlib/patches.py", line
165, in draw
tverts = self._transform.seq_xy_tups(verts)
ValueError: Domain error on nonlinear Transformation::seq_xy_tups
operator()(thisx, thisy)
The error is always reproducible, both from the console and the ipython console.
Any ideas?
···
On 7/22/06, Gary Ruben <gruben@...636...> wrote:
More information on this bug: on my WinXP laptop, it seems to only
manifest under some circumstances. When running the script from inside
SciTE or ipython, it seems more or less repeatable (sometimes it won't
show on the first run but does from then on), but if the .py file is run
directly from the windows explorer, it doesn't show up. On my win98
desktop, however, it shows up regardless.
Gary Ruben wrote:
> Note: I just verified that this was introduced into 0.87.4.
> 0.87.3 doesn't exhibit the problem. See attachment.
>
> Gary R.
>
> gruben@...636... wrote:
>> The following minimal script reveals a rendering problem with
>> displaying a histogram on a log vertical axis.
>> I'm using matplotlib0.87.4 in WinXP with python 2.3.5 Enthon.
>>
>> from pylab import *
>> hist(rand(100), 20, bottom=1)
>> setp(gca(), yscale="log")
>> show()
>>
>> Gary R.
--
Web/Blog/Gallery: http://floatingsun.net/blog
The problem is still present in svn. Thanks for the reminder.
Eric
Diwaker Gupta wrote:
···
The following minimal script reveals a rendering problem with
displaying a histogram on a log vertical axis.
Has this been resolved yet? I'm running Matplotlib 0.87.5-2.2 on
Debian Unstable. I try to run the following script:
from pylab import *
hist(rand(100), 20)
ax = gca()
ax.set_yscale('log')
show()
And get the error:
Traceback (most recent call last):
File "/usr/lib/python2.4/site-packages/matplotlib/backends/backend_gtk.py",
line 284, in expose_event
self._render_figure(self._pixmap, w, h)
File "/usr/lib/python2.4/site-packages/matplotlib/backends/backend_gtkagg.py",
line 73, in _render_figure
FigureCanvasAgg.draw(self)
File "/usr/lib/python2.4/site-packages/matplotlib/backends/backend_agg.py",
line 391, in draw
self.figure.draw(renderer)
File "/usr/lib/python2.4/site-packages/matplotlib/figure.py", line
538, in draw
for a in self.axes: a.draw(renderer)
File "/usr/lib/python2.4/site-packages/matplotlib/axes.py", line 1057, in draw
a.draw(renderer)
File "/usr/lib/python2.4/site-packages/matplotlib/patches.py", line
165, in draw
tverts = self._transform.seq_xy_tups(verts)
ValueError: Domain error on nonlinear Transformation::seq_xy_tups
operator()(thisx, thisy)
The error is always reproducible, both from the console and the ipython console.
Any ideas?
On 7/22/06, Gary Ruben <gruben@...636...> wrote:
More information on this bug: on my WinXP laptop, it seems to only
manifest under some circumstances. When running the script from inside
SciTE or ipython, it seems more or less repeatable (sometimes it won't
show on the first run but does from then on), but if the .py file is run
directly from the windows explorer, it doesn't show up. On my win98
desktop, however, it shows up regardless.
Gary Ruben wrote:
Note: I just verified that this was introduced into 0.87.4.
0.87.3 doesn't exhibit the problem. See attachment.
Gary R.
gruben@...636... wrote:
The following minimal script reveals a rendering problem with
displaying a histogram on a log vertical axis.
I'm using matplotlib0.87.4 in WinXP with python 2.3.5 Enthon.
from pylab import *
hist(rand(100), 20, bottom=1)
setp(gca(), yscale="log")
show()
Gary R.