Hi,
I had one or two more looks at the hist() function. There are a few things I wondered about:
(I) Isn't it more intuitive to interpret the "width" keyword as "width relative to the real width of a bin" rather than as an absolute value ? Here is an example, why I think so: Say I want to create a histogram where the individual bars touch each other. First create some data
In [3]: sigma * 38.
In [4]: Y = sigma * numpy.random.randn(1000)
In [5]: pylab.hist(Y)
By default, this produces a histogram where there is some space between the bars. But how should I now (in advance) what the width will be? That depends on the retuned bins of the numpy.histogram routine, so the only direct solution would be
In [6]: n, bins, patches = pylab.hist(Y)
In [7]: pylab.clf()
In [8]: n, bins, patches = pylab.hist(Y, width=bins[1]-bins[0])
(II) If width < real_width_of_a-bin, why is the bar aligned to the left edge of the bin, not to its center? (That different from the align='center' behaviour). Try a width that is << real_width_of_a-bin . The result looks strange to me and is hard to interpret.
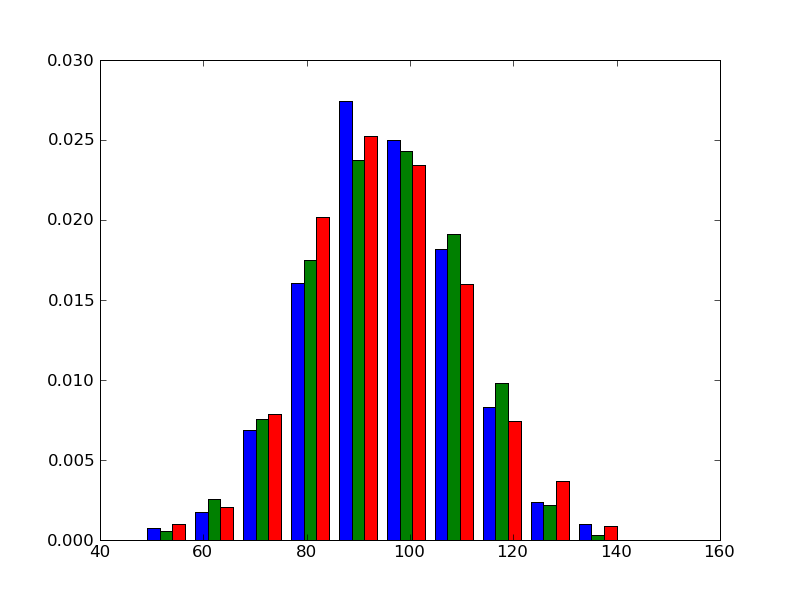
(III) Now the real interesting thing !!! matlab has the ability to create a kind of combined histogram, if the input is not an 1d array, but a matrix. So, I played a little bit around and added such a feature to the matplotlib hist method. It isn't finished yet, but might be of interest ???
from pylab import *
import numpy
mu, sigma = 100, 15
x = mu + sigma*numpy.random.randn(1000,3)
ret = hist(x, 10, normed=True)
show()
... produces a figure as attached.
Manuel
 I continued my work on the hist() method. I just committed a patch with some major re-writing of the hist() method to the trunk. I personally think it is very useful. hist() now