Dear matplotters,
encouraged from the excellent response times to my last problem, I am trying to explore more features of matplotlib.
My current problem is with hexbin.
I have been using numpy.histogram2d and imshow so far for 2d histograms, but I must admit that hexbin looks quite pretty.
In order to emphasize small differences over a large scale, I am using hexbin with the bins=‘log’ option.
The result is very nice, but when I add a pyplot.colorbar(), I would like to have the original number of entries on the ticks, not their log10.
Ideally, I’d change the yaxis of the colorbar to a logscale, and use numpy.power(10, yaxis_values) on it.
I think colorbar().ax.set_yscale(‘log’) should do what I need for the first part, but how do I get the original number of entries back, rather than their log10.
I could cheat and simply replace each ticklabel with 10^ticklabel, but I don’t even know how to do that.
Thanks for any pointers,
Cheers,
Jan
Jan Strube wrote:
Dear matplotters,
encouraged from the excellent response times to my last problem, I am trying to explore more features of matplotlib.
My current problem is with hexbin.
I have been using numpy.histogram2d and imshow so far for 2d histograms, but I must admit that hexbin looks quite pretty.
In order to emphasize small differences over a large scale, I am using hexbin with the bins='log' option.
The result is very nice, but when I add a pyplot.colorbar(), I would like to have the original number of entries on the ticks, not their log10.
Ideally, I'd change the yaxis of the colorbar to a logscale, and use numpy.power(10, yaxis_values) on it.
I think colorbar().ax.set_yscale('log') should do what I need for the first part, but how do I get the original number of entries back, rather than their log10.
I could cheat and simply replace each ticklabel with 10^ticklabel, but I don't even know how to do that.
Offhand, I suspect this would be the best solution at present, if the only problem now is that you want the ticklabels written differently. Try using the "format" kwarg of the colorbar, supplying either a format string or a formatter.
Something like this (untested):
from matplotlib.ticker import LogFormatter
class LogFormatterHB(LogFormatter):
def __call__(self, v, pos=None):

    vv = self._base ** v

    return LogFormatter.__call__(self, vv, pos)
...
cbar = colorbar( ... , format=LogFormatterHB())
Eric
Hi Eric,
thanks for your response.
Your solution looks like it’s going to return the right numbers, but for some reason the tick labels are gone completely. (Except 0)
The code I have is below. I do think the current behavior is a bug, but if I can get your workaround to go, I’ll be happy.
Thanks for your help.
Cheers,
Jan
-- coding: utf-8 --
from future import division
import matplotlib.pyplot as pl
import numpy as np
data = np.load(‘deltaR_photonIso_parton_jet_109370.npz’)
ptcut = np.logical_and(data[‘jetMomentum’] < 300000, data[‘jetMomentum’]>0)
deltaRCut = data[‘deltaR’]>0
cut = np.logical_and(ptcut, deltaRCut)
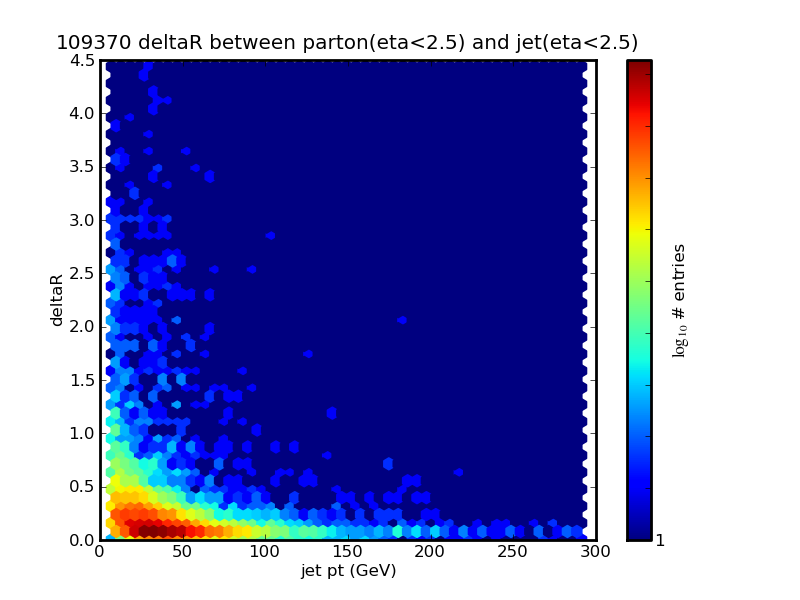
pl.hexbin(data[‘jetMomentum’][cut] / 1000, data[‘deltaR’][cut], gridsize=50, bins=‘log’)
pl.title(‘deltaR between parton(eta<2.5) and jet(eta<2.5)’)
pl.xlabel(‘jet pt (GeV)’)
pl.ylabel(‘deltaR’)
cb = pl.colorbar()
cb.set_label(‘\log_{10} # entries’)
pl.show
deltaR_photonIso_parton_jet_109370.npz (149 KB)
···
On Wed, Feb 17, 2010 at 7:00 PM, Eric Firing <efiring@…202…> wrote:
Jan Strube wrote:
Dear matplotters,
encouraged from the excellent response times to my last problem, I am trying to explore more features of matplotlib.
My current problem is with hexbin.
I have been using numpy.histogram2d and imshow so far for 2d histograms, but I must admit that hexbin looks quite pretty.
In order to emphasize small differences over a large scale, I am using hexbin with the bins=‘log’ option.
The result is very nice, but when I add a pyplot.colorbar(), I would like to have the original number of entries on the ticks, not their log10.
Ideally, I’d change the yaxis of the colorbar to a logscale, and use numpy.power(10, yaxis_values) on it.
I think colorbar().ax.set_yscale(‘log’) should do what I need for the first part, but how do I get the original number of entries back, rather than their log10.
I could cheat and simply replace each ticklabel with 10^ticklabel, but I don’t even know how to do that.
Offhand, I suspect this would be the best solution at present, if the only problem now is that you want the ticklabels written differently. Try using the “format” kwarg of the colorbar, supplying either a format string or a formatter.
Something like this (untested):
from matplotlib.ticker import LogFormatter
class LogFormatterHB(LogFormatter):
def __call__(self, v, pos=None):

    vv = self._base ** v

    return LogFormatter.__call__(self, vv, pos)
…
cbar = colorbar( … , format=LogFormatterHB())
Eric
Hi Eric,
thanks for your response.
Your solution looks like it’s going to return the right numbers, but for some reason the tick labels are gone completely. (Except 0)
The code I
have is below. If I can get your workaround to go, I’ll be happy.
Thanks for your help.
Cheers,
Jan
-- coding: utf-8 --
from future import division
import matplotlib.pyplot as pl
import numpy as np
data
= np.load(‘deltaR_parton_jet_109371.npz’)
ptcut = np.logical_and(data[‘jetMomentum’] < 300000, data[‘jetMomentum’]>0)
deltaRCut = data[‘deltaR’]>0
cut = np.logical_and(ptcut, deltaRCut)
pl.hexbin(data[‘jetMomentum’][cut] / 1000, data[‘deltaR’][cut], gridsize=50, bins=‘log’)
pl.title(‘deltaR between parton(eta<2.5) and jet(eta<2.5)’)
pl.xlabel(‘jet pt (GeV)’)
pl.ylabel(‘deltaR’)
cb = pl.colorbar()
cb.set_label('\log_{10}
entries’)
pl.show()
deltaR_parton_jet_109371.npz (70.7 KB)
···
On Wed, Feb 17, 2010 at 7:00 PM, Eric Firing <efiring@…202…> wrote:
Jan Strube wrote:
Dear matplotters,
encouraged from the excellent response times to my last problem, I am trying to explore more features of matplotlib.
My current problem is with hexbin.
I have been using numpy.histogram2d and imshow so far for 2d histograms, but I must admit that hexbin looks quite pretty.
In order to emphasize small differences over a large scale, I am using hexbin with the bins=‘log’ option.
The result is very nice, but when I add a pyplot.colorbar(), I would like to have the original number of entries on the ticks, not their log10.
Ideally, I’d change the yaxis of the colorbar to a logscale, and use numpy.power(10, yaxis_values) on it.
I think colorbar().ax.set_yscale(‘log’) should do what I need for the first part, but how do I get the original number of entries back, rather than their log10.
I could cheat and simply replace each ticklabel with 10^ticklabel, but I don’t even know how to do that.
Offhand, I suspect this would be the best solution at present, if the only problem now is that you want the ticklabels written differently. Try using the “format” kwarg of the colorbar, supplying either a format string or a formatter.
Something like this (untested):
from matplotlib.ticker import LogFormatter
class LogFormatterHB(LogFormatter):
def __call__(self, v, pos=None):

    vv = self._base ** v

    return LogFormatter.__call__(self, vv, pos)
…
cbar = colorbar( … , format=LogFormatterHB())
Eric
What's the bug -- the fact that the tick labels are the log10 of the
number instead of the number?
I tried Eric's proposal with your code and it is working for me
(colorbar tick labels at 1, 10 and 100)
JDH
import matplotlib.pyplot as plt
import numpy as np
from matplotlib.ticker import LogFormatter
class LogFormatterHB(LogFormatter):
def __call__(self, v, pos=None):
vv = self._base ** v
return LogFormatter.__call__(self, vv, pos)
data = np.load('deltaR_parton_jet_109371.npz')
ptcut = np.logical_and(data['jetMomentum'] < 300000, data['jetMomentum']>0)
deltaRCut = data['deltaR']>0
cut = np.logical_and(ptcut, deltaRCut)
fig = plt.figure()
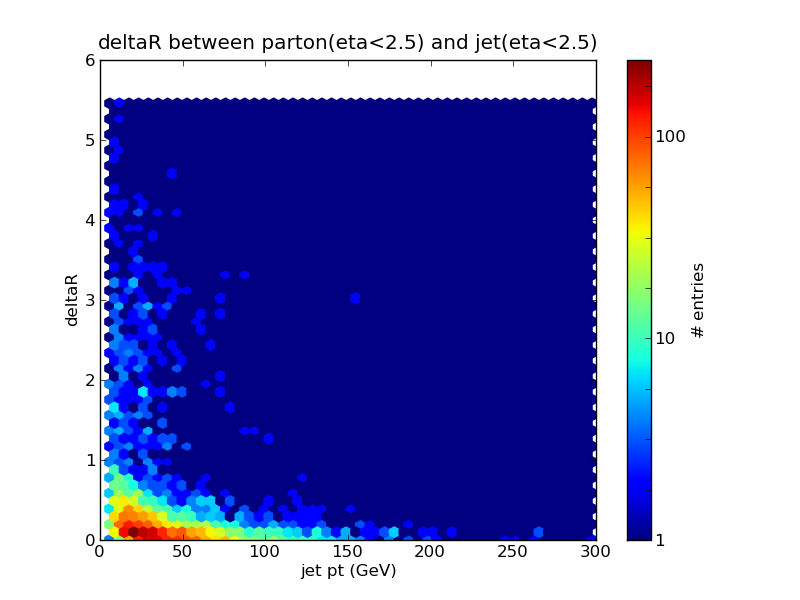
plt.hexbin(data['jetMomentum'][cut] / 1000, data['deltaR'][cut],
gridsize=50, bins='log')
plt.title('deltaR between parton(eta<2.5) and jet(eta<2.5)')
plt.xlabel('jet pt (GeV)')
plt.ylabel('deltaR')
cb = plt.colorbar(format=LogFormatterHB())
cb.set_label('# entries')
plt.show()
···
On Thu, Feb 18, 2010 at 10:25 AM, Jan Strube <curiousjan@...287...> wrote:
Hi Eric,
thanks for your response.
Your solution looks like it's going to return the right numbers, but for
some reason the tick labels are gone completely. (Except 0)
The code I have is below. I do think the current behavior is a bug, but if I
can get your workaround to go, I'll be happy.
Hi John,
thanks for trying this also. Yes, I think it’s a bug that not the scale is log, but the data is.
Unfortunately, the solution really doesn’t work for me.
Please see the attached screenshot. (Yes, it still says log_10 entries, but the code is otherwise the same)
In [2]: matplotlib.version
Out[2]: ‘1.0.svn’
This is r8063, I think.
Strange that I get different results. Could this be a backend problem? I use PyQT4.
I’d be happy to also update from svn if you think that helps.
Cheers,
Jan
···
On Thu, Feb 18, 2010 at 5:42 PM, John Hunter <jdh2358@…287…> wrote:
On Thu, Feb 18, 2010 at 10:25 AM, Jan Strube <curiousjan@…287…> wrote:
Hi Eric,
thanks for your response.
Your solution looks like it’s going to return the right numbers, but for
some reason the tick labels are gone completely. (Except 0)
The code I have is below. I do think the current behavior is a bug, but if I
can get your workaround to go, I’ll be happy.
What’s the bug – the fact that the tick labels are the log10 of the
number instead of the number?
I tried Eric’s proposal with your code and it is working for me
(colorbar tick labels at 1, 10 and 100)
JDH
import matplotlib.pyplot as plt
import numpy as np
from matplotlib.ticker import LogFormatter
class LogFormatterHB(LogFormatter):
def __call__(self, v, pos=None):
vv = self._base ** v
return LogFormatter.__call__(self, vv, pos)
data = np.load(‘deltaR_parton_jet_109371.npz’)
ptcut = np.logical_and(data[‘jetMomentum’] < 300000, data[‘jetMomentum’]>0)
deltaRCut = data[‘deltaR’]>0
cut = np.logical_and(ptcut, deltaRCut)
fig = plt.figure()
plt.hexbin(data[‘jetMomentum’][cut] / 1000, data[‘deltaR’][cut],
gridsize=50, bins=‘log’)
plt.title(‘deltaR between parton(eta<2.5) and jet(eta<2.5)’)
plt.xlabel(‘jet pt (GeV)’)
plt.ylabel(‘deltaR’)
cb = plt.colorbar(format=LogFormatterHB())
cb.set_label(‘# entries’)
plt.show()
I'm running svn but not svn HEAD -- you should try updating to HEAD
and I will do the same later (unfortunately HEAD is broken on my work
machine (solaris, python2.4) because of the CXX upgrade I put in some
time ago. I think I am on r8083.
I do not think this difference could be caused by a backend or GUI
version difference as all of the formatting logic happens in the
frontend. If we are on the same version of svn, we should be getting
the same tick labels.
JDH
···
On Thu, Feb 18, 2010 at 4:06 PM, Jan Strube <curiousjan@...287...> wrote:
Hi John,
thanks for trying this also. Yes, I think it's a bug that not the scale is
log, but the data is.
Unfortunately, the solution really doesn't work for me.
Please see the attached screenshot. (Yes, it still says log_10 entries, but
the code is otherwise the same)
In [2]: matplotlib.__version__
Out[2]: '1.0.svn'
This is r8063, I think.
Strange that I get different results. Could this be a backend problem? I use
PyQT4.
I'd be happy to also update from svn if you think that helps.
Hi John,
I am now at r8141.
I don’t see a difference. There’s a one at the bottom of the scale, that’s all.
I am copying and pasting the code in your other email into a python console.
It’s a bit strange, because when I put in a print statement, I see that the method gets called a number of times…
[edit] I see what’s going on. If I replace vv with a large constant (like 100), it never gets printed.
If I replace vv with a small constant (like 1), that is below the range of the scale, it does get printed at each tick.[/edit]
My setup is kubuntu karmic, dependencies listed below.
I have removed my matplotlibrc, but the result is the same. I am attaching it nevertheless…
Cheers,
Jan
matplotlibrc (16.6 KB)
···
============================================================================
BUILDING MATPLOTLIB
            matplotlib: 1.0.svn
                python: 2.6.4 (r264:75706, Nov  2 2009, 14:44:17)  [GCC
                        4.4.1]
              platform: linux2

REQUIRED DEPENDENCIES
                 numpy: 1.3.0
             freetype2: 9.20.3

OPTIONAL BACKEND DEPENDENCIES
                libpng: 1.2.37
               Tkinter: no
                        * TKAgg requires Tkinter
              wxPython: no
                        * wxPython not found
            pkg-config: looking for pygtk-2.0 gtk+-2.0
                        * Package pygtk-2.0 was not found in the pkg-config
                        * search path. Perhaps you should add the directory
                        * containing `pygtk-2.0.pc' to the PKG_CONFIG_PATH
                        * environment variable No package 'pygtk-2.0' found
                        * Package gtk+-2.0 was not found in the pkg-config
                        * search path. Perhaps you should add the directory
                        * containing `gtk+-2.0.pc' to the PKG_CONFIG_PATH
                        * environment variable No package 'gtk+-2.0' found
                        * You may need to install 'dev' package(s) to
                        * provide header files.
                  Gtk+: no
                        * Could not find Gtk+ headers in any of
                        * '/usr/local/include', '/usr/include', '.'
       Mac OS X native: no
                    Qt: no
                   Qt4: Qt: 4.5.2, PyQt4: 4.6
                 Cairo: 1.8.6

OPTIONAL DATE/TIMEZONE DEPENDENCIES
              datetime: present, version unknown
              dateutil: 1.4.1
                  pytz: 2009l

OPTIONAL USETEX DEPENDENCIES
                dvipng: 1.12
           ghostscript: 8.70
                 latex: 3.1415926
               pdftops: 0.12.0

[Edit setup.cfg to suppress the above messages]
============================================================================
On Thu, Feb 18, 2010 at 10:29 PM, John Hunter <jdh2358@…287…> wrote:
On Thu, Feb 18, 2010 at 4:06 PM, Jan Strube <curiousjan@…287…> wrote:
Hi John,
thanks for trying this also. Yes, I think it’s a bug that not the scale is
log, but the data is.
Unfortunately, the solution really doesn’t work for me.
Please see the attached screenshot. (Yes, it still says log_10 entries, but
the code is otherwise the same)
In [2]: matplotlib.version
Out[2]: ‘1.0.svn’
This is r8063, I think.
Strange that I get different results. Could this be a backend problem? I use
PyQT4.
I’d be happy to also update from svn if you think that helps.
I’m running svn but not svn HEAD – you should try updating to HEAD
and I will do the same later (unfortunately HEAD is broken on my work
machine (solaris, python2.4) because of the CXX upgrade I put in some
time ago. I think I am on r8083.
I do not think this difference could be caused by a backend or GUI
version difference as all of the formatting logic happens in the
frontend. If we are on the same version of svn, we should be getting
the same tick labels.
JDH
Hi John, Eric,
sorry to bug again, but was either of you able to reproduce my findings that in svn head the tick labels don’t get printed if the formatter changes them to be outside the range of the axis?
Cheers,
Jan
···
On Fri, Feb 19, 2010 at 10:40 AM, Jan Strube <curiousjan@…287…> wrote:
Hi John,
I am now at r8141.
I don’t see a difference. There’s a one at the bottom of the scale, that’s all.
I am copying and pasting the code in your other email into a python console.
It’s a bit strange, because when I put in a print statement, I see that the method gets called a number of times…
[edit] I see what’s going on. If I replace vv with a large constant (like 100), it never gets printed.
If I replace vv with a small constant (like 1), that is below the range of the scale, it does get printed at each tick.[/edit]
My setup is kubuntu karmic, dependencies listed below.
I have removed my matplotlibrc, but the result is the same. I am attaching it nevertheless…
Cheers,
Jan
============================================================================


BUILDING MATPLOTLIB
            matplotlib: 1.0.svn


                python: 2.6.4 (r264:75706, Nov  2 2009, 14:44:17)  [GCC
                        4.4.1]


              platform: linux2


REQUIRED DEPENDENCIES
                 numpy: 1.3.0


             freetype2: 9.20.3


OPTIONAL BACKEND DEPENDENCIES
                libpng: 1.2.37


               Tkinter: no
                        * TKAgg requires Tkinter


              wxPython: no
                        * wxPython not found


            pkg-config: looking for pygtk-2.0 gtk+-2.0
                        * Package pygtk-2.0 was not found in the pkg-config


                        * search path. Perhaps you should add the directory
                        * containing `pygtk-2.0.pc' to the PKG_CONFIG_PATH


                        * environment variable No package 'pygtk-2.0' found
                        * Package gtk+-2.0 was not found in the pkg-config


                        * search path. Perhaps you should add the directory
                        * containing `gtk+-2.0.pc' to the PKG_CONFIG_PATH


                        * environment variable No package 'gtk+-2.0' found
                        * You may need to install 'dev' package(s) to


                        * provide header files.
                  Gtk+: no


                        * Could not find Gtk+ headers in any of
                        * '/usr/local/include', '/usr/include', '.'


       Mac OS X native: no
                    Qt: no


                   Qt4: Qt: 4.5.2, PyQt4: 4.6
                 Cairo: 1.8.6


OPTIONAL DATE/TIMEZONE DEPENDENCIES


              datetime: present, version unknown
              dateutil: 1.4.1


                  pytz: 2009l


OPTIONAL USETEX DEPENDENCIES
                dvipng: 1.12


           ghostscript: 8.70
                 latex: 3.1415926


               pdftops: 0.12.0


[Edit setup.cfg to suppress the above messages]
============================================================================
On Thu, Feb 18, 2010 at 10:29 PM, John Hunter <jdh2358@…287…> wrote:
On Thu, Feb 18, 2010 at 4:06 PM, Jan Strube <curiousjan@…287…> wrote:
Hi John,
thanks for trying this also. Yes, I think it’s a bug that not the scale is
log, but the data is.
Unfortunately, the solution really doesn’t work for me.
Please see the attached screenshot. (Yes, it still says log_10 entries, but
the code is otherwise the same)
In [2]: matplotlib.version
Out[2]: ‘1.0.svn’
This is r8063, I think.
Strange that I get different results. Could this be a backend problem? I use
PyQT4.
I’d be happy to also update from svn if you think that helps.
I’m running svn but not svn HEAD – you should try updating to HEAD
and I will do the same later (unfortunately HEAD is broken on my work
machine (solaris, python2.4) because of the CXX upgrade I put in some
time ago. I think I am on r8083.
I do not think this difference could be caused by a backend or GUI
version difference as all of the formatting logic happens in the
frontend. If we are on the same version of svn, we should be getting
the same tick labels.
JDH
Hi John, Eric,
sorry to bug again, but was either of you able to reproduce my findings that
in svn head the tick labels don't get printed if the formatter changes them
to be outside the range of the axis?
On svn HEAD (r8142) (and the branch) I get the attached figure with
the attached code. I'm running the code with
python test.py
from the python shell. Are you getting a different result?
JDH
test.py (736 Bytes)
···
On Mon, Feb 22, 2010 at 2:42 AM, Jan Strube <curiousjan@...287...> wrote: