help on colorbar usage

(from phil:)

I want to arrange the colorbar so that a very small number of colors
are displayed rather than the "continuous shading" that most of the
example plots are using. This lets viewers of the figure unambiguously
identify precisely the range of value in the filled region.

(from Jeff:)

Note that that contourf is using 10 discrete colors to represent the data, but the colorbar is showing all 256 colors in the colormap. Do you know of any way to force the colorbar to show only those colors
that contourf uses?

Phil, Jeff,

Yes, the present colorbar is designed for use with images, not with contourf, and fixing it (or making a new one) is something I have wanted to do for quite a while. I just haven't gotten to it yet. Prompted by your two emails, maybe I can at least take a close look during the next week to see what it would take. It might be easy--probably is. No promises yet, though.

Eric

(from phil:)

.... stuff deleted ......

Phil, Jeff,

Yes, the present colorbar is designed for use with images, not with
contourf, and fixing it (or making a new one) is something I have wanted
to do for quite a while. I just haven't gotten to it yet. Prompted by
your two emails, maybe I can at least take a close look during the next
week to see what it would take. It might be easy--probably is. No
promises yet, though.

Eric

Thanks Eric,

I also believe it should be easy to do. But it is better done by
somebody more familiar with matplotlib and python than I. I have
written such codes for other languages but need more practice before
I could do it elegantly in python.

As long as you are digging around in there, can I have you think about
another couple features?

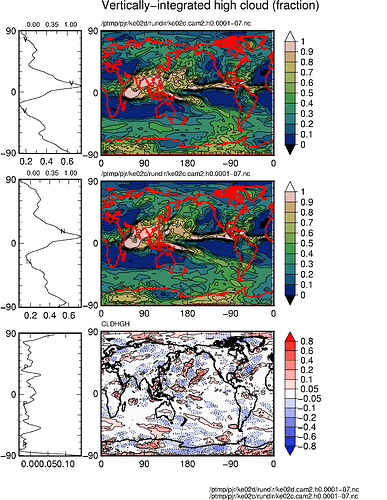
1) The best colorbars in my mind have "triangles" at the endpoints
that indicate the color for the region higher than the highest
contour, and lower than the lowest contours. This allows one to label
only the meaningful boundaries and not specify how much above or below
those regions.

2) I frequently need to set contour intervals (the filled region
boundaries) to be approximately logarithmic. But I dont want to have
these filled regions occupy a fraction of the colorbar proportional to
their fraction of the total interval. I want each region to be equal
area on the colorbar.

An example of these features can be seen in the attached PNG figure
that I created in Yorick with a colorbar code I wrote. I havent tried
for beauty, but these figure are OK for for working plots. You can see
the point for the unequal contour intervals in the difference plot at
the bottom.

For the codes I wrote this necessitated supplying arguments to the
colorbar function like....

colorbar(levs, colors)
where levels was an N element array, and colors was an N+1 element
list containing color info for each filled region.

Thanks for listening.

Phil

···

On Mon, Aug 22, 2005 at 12:55:16PM -1000, Eric Firing wrote:
Phil Rasch wrote:

···

On Mon, Aug 22, 2005 at 12:55:16PM -1000, Eric Firing wrote:

(from phil:)

.... stuff deleted ......

Phil, Jeff,

Yes, the present colorbar is designed for use with images, not with contourf, and fixing it (or making a new one) is something I have wanted to do for quite a while. I just haven't gotten to it yet. Prompted by your two emails, maybe I can at least take a close look during the next week to see what it would take. It might be easy--probably is. No promises yet, though.

Eric

Thanks Eric,

I also believe it should be easy to do. But it is better done by
somebody more familiar with matplotlib and python than I. I have
written such codes for other languages but need more practice before
I could do it elegantly in python.

As long as you are digging around in there, can I have you think about
another couple features?

1) The best colorbars in my mind have "triangles" at the endpoints
that indicate the color for the region higher than the highest
contour, and lower than the lowest contours. This allows one to label
only the meaningful boundaries and not specify how much above or below
those regions.

2) I frequently need to set contour intervals (the filled region
boundaries) to be approximately logarithmic. But I dont want to have
these filled regions occupy a fraction of the colorbar proportional to
their fraction of the total interval. I want each region to be equal
area on the colorbar.

An example of these features can be seen in the attached PNG figure
that I created in Yorick with a colorbar code I wrote. I havent tried
for beauty, but these figure are OK for for working plots. You can see
the point for the unequal contour intervals in the difference plot at
the bottom.

For the codes I wrote this necessitated supplying arguments to the
colorbar function like....

colorbar(levs, colors)
where levels was an N element array, and colors was an N+1 element
list containing color info for each filled region.

Thanks for listening.

Phil

Phil,

As long as you are digging around in there, can I have you think about
another couple features?

OK.

An example of these features can be seen in the attached PNG figure

I think you forgot to attach the figure--I didn't see it. Your description is pretty clear, though.

Eric

Just for completness I will attach the figure this time.

Phil

···

On Mon, Aug 22, 2005 at 02:02:57PM -1000, Eric Firing wrote:

Phil Rasch wrote:
>On Mon, Aug 22, 2005 at 12:55:16PM -1000, Eric Firing wrote:
>
>>(from phil:)
>
>.... stuff deleted ......
>
>>Phil, Jeff,
>>
>>Yes, the present colorbar is designed for use with images, not with
>>contourf, and fixing it (or making a new one) is something I have wanted
>>to do for quite a while. I just haven't gotten to it yet. Prompted by
>>your two emails, maybe I can at least take a close look during the next
>>week to see what it would take. It might be easy--probably is. No
>>promises yet, though.
>>
>>Eric
>
>
>Thanks Eric,
>
>I also believe it should be easy to do. But it is better done by
>somebody more familiar with matplotlib and python than I. I have
>written such codes for other languages but need more practice before
>I could do it elegantly in python.
>
>As long as you are digging around in there, can I have you think about
>another couple features?
>
>1) The best colorbars in my mind have "triangles" at the endpoints
>that indicate the color for the region higher than the highest
>contour, and lower than the lowest contours. This allows one to label
>only the meaningful boundaries and not specify how much above or below
>those regions.
>
>2) I frequently need to set contour intervals (the filled region
>boundaries) to be approximately logarithmic. But I dont want to have
>these filled regions occupy a fraction of the colorbar proportional to
>their fraction of the total interval. I want each region to be equal
>area on the colorbar.
>
>An example of these features can be seen in the attached PNG figure
>that I created in Yorick with a colorbar code I wrote. I havent tried
>for beauty, but these figure are OK for for working plots. You can see
>the point for the unequal contour intervals in the difference plot at
>the bottom.
>
>For the codes I wrote this necessitated supplying arguments to the
>colorbar function like....
>
>colorbar(levs, colors)
>where levels was an N element array, and colors was an N+1 element
>list containing color info for each filled region.
>
>Thanks for listening.
>
>Phil
>

--
Phil Rasch, Climate Modeling Section, National Center for Atmospheric Research
Mail --> P.O. Box 3000, Boulder CO 80307
Shipping --> 1850 Table Mesa Dr, Boulder, CO 80305
email: pjr@...157..., Web: http://www.cgd.ucar.edu/cms/pjr Phone: 303-497-1368, FAX: 303-497-1324