Hi all,
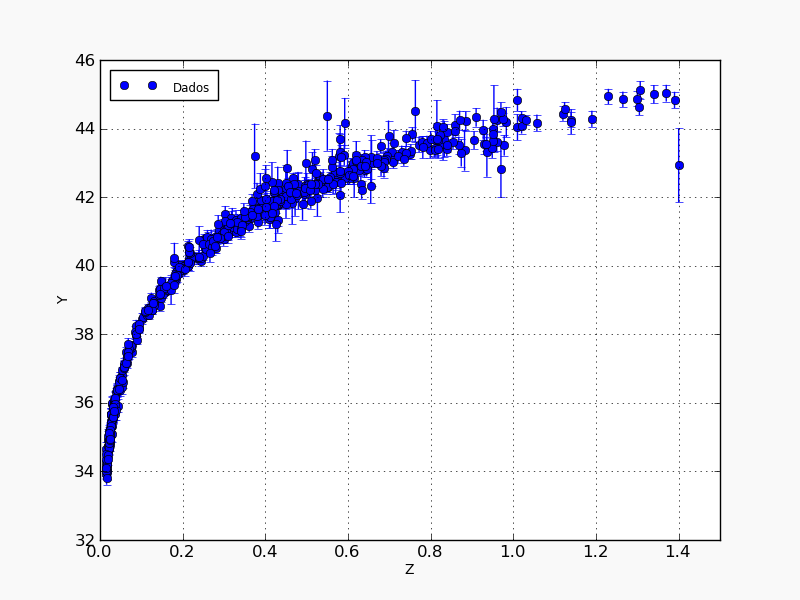
I have a graph. I plotted using python, matplotlib. And i have an example.
I need to let the x-axis of my graph, and how do I change plt.ylabel (‘Y’, size = 10) as the example.
Example: In my graph, the x-axis this way: 0.0 ----- 0.2 ------ 0.4 ----- 0.6 ------- 0.8 ------- 1.0 ------- 1.2 -------- 1.4
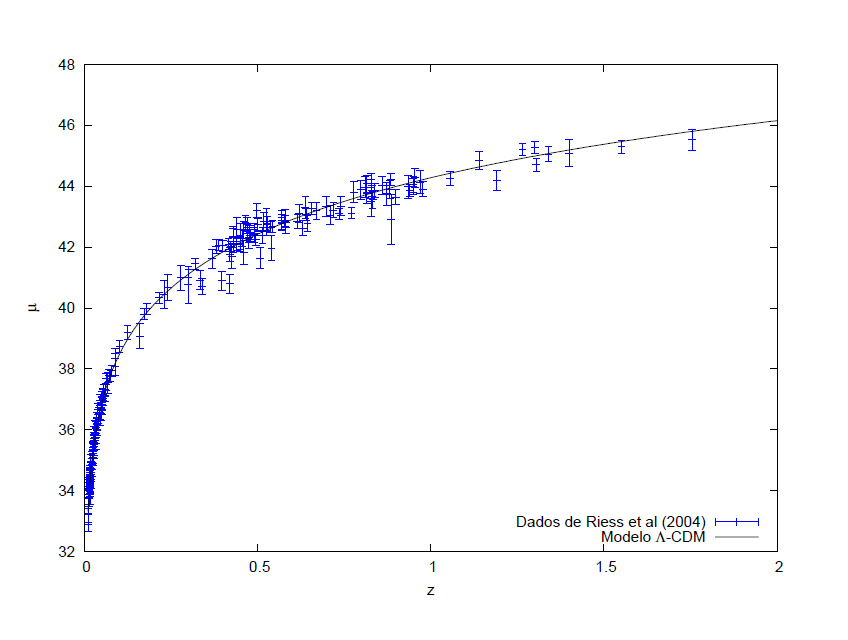
I need this way: 0 ----- 0.5 ------ 1.0 ----- 1.5 -------- 2
My code: http://pastebin.com/GZqWKwZf
Can you help me?
Thanks
Waleria
2010/10/19 Waléria Antunes David <waleriantunes@...287...>:
Example: In my graph, the x-axis this way: 0.0 ----- 0.2 ------ 0.4 -----
0.6 ------- 0.8 ------- 1.0 ------- 1.2 -------- 1.4
I need this way: 0 ----- 0.5 ------ 1.0 ----- 1.5 -------- 2
you might use mpl.ticker.MaxNLocator(4).
Install it in the Axes using
ax.set_major_locator(mpl.ticker.MaxNLocator(4, steps=[1, 2, 5, 10])).
The number is the maximum number of bins. *steps* are the allowed
steps by which to step between bin boundaries. See the docs (module
mpl.ticker) for details!
Friedrich