Hi,
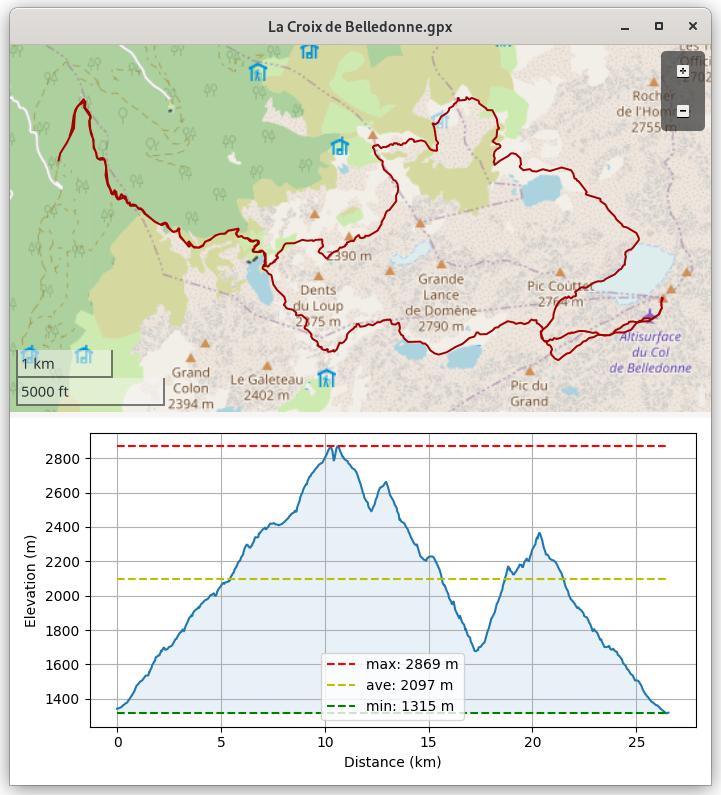
I am struggling with the matplolib gtk4agg FigureCanvas. I tried several settings but the xlabel is always truncated (visible if the window is set to fullscreen mode):
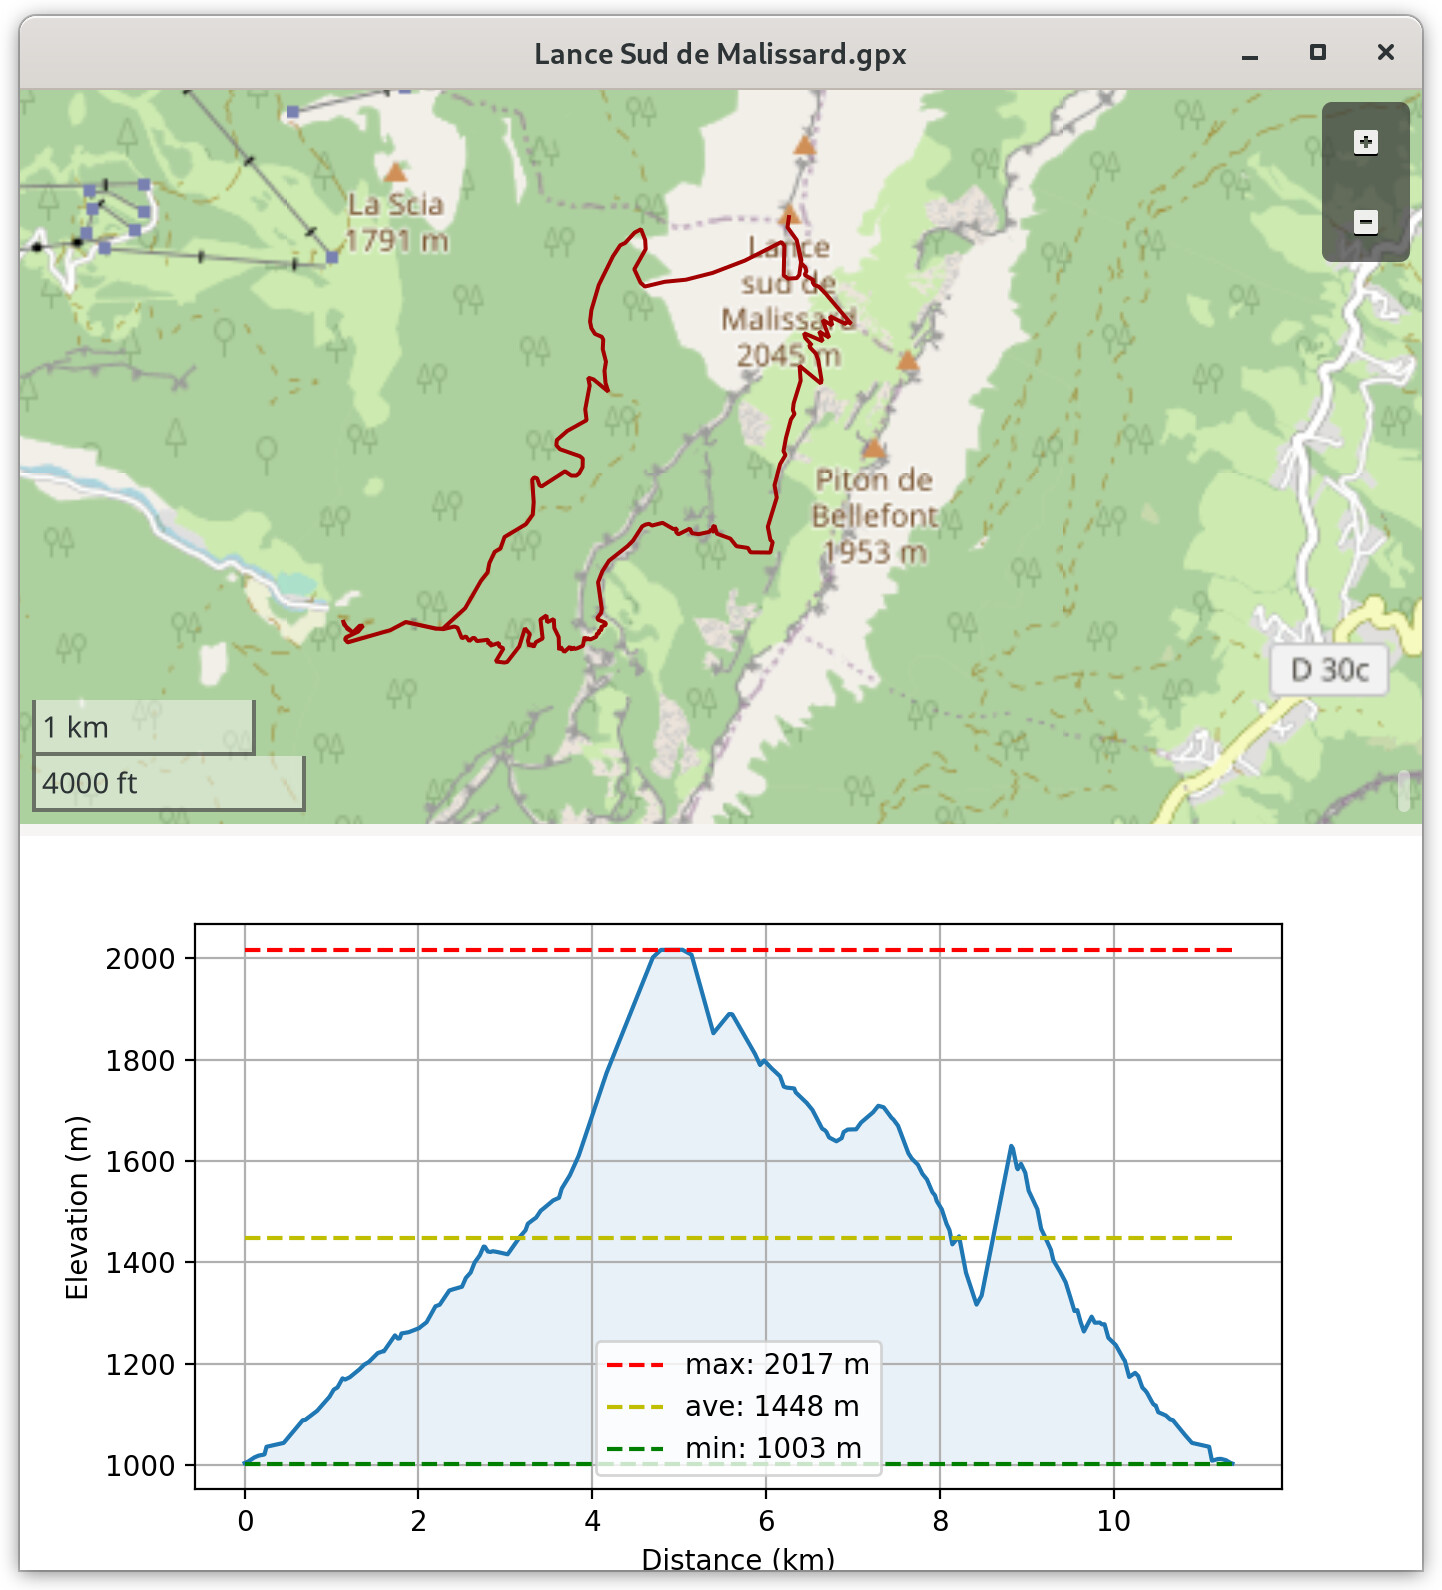
Below is the snippet of code I am using:
import os


from matplotlib.backends.backend_gtk4agg import FigureCanvas  # or gtk4cairo
from matplotlib.figure import Figure


from gi.repository import Gio, Gtk, Shumate


from pygpxviewer.helpers import gpx_helper


class AppWindowDetails(Gtk.Window):
    __gtype_name__ = "app_window_details"

    def __init__(self, gpx_file):
        super().__init__()

        gpx_helper.set_gpx(gpx_file)
        self.map_bounds = gpx_helper.get_gpx_bounds()
        self.map_locations = gpx_helper.get_gpx_locations()

        self.set_title(os.path.basename(gpx_file))
        self.settings = Gio.Settings.new("com.github.pygpxviewer.app.window.details")

        figure = self.get_matplotlib_figure(gpx_file)
        canvas = FigureCanvas(figure)

        box = Gtk.Box.new(Gtk.Orientation.VERTICAL, 6)
        box.set_homogeneous(True)
        box.append(canvas)

        self.set_child(box)

    def get_matplotlib_figure(self, gpx_file):
        gpx_helper.set_gpx(gpx_file)
        length = gpx_helper.get_gpx_length()
        min_elev, max_elev = gpx_helper.get_gpx_elevation_extremes()
        distances, elevations = gpx_helper.get_gpx_distances_and_elevations()

        min_elev = round(min_elev)
        max_elev = round(max_elev)
        mean_elev = round((sum(elevations)/len(elevations)))

        figure = Figure()
        figure.tight_layout()

        ax = figure.add_subplot()
        ax.grid()
        ax.plot(distances, elevations)
        ax.plot([0, length], [max_elev, max_elev], '--r', label='max: '+str(max_elev)+' m')
        ax.plot([0, length], [mean_elev, mean_elev], '--y', label='ave: '+str(mean_elev)+' m')
        ax.plot([0, length], [min_elev, min_elev], '--g', label='min: '+str(min_elev)+' m')
        ax.fill_between(distances, elevations, min_elev, alpha=0.1)
        ax.set_xlabel("Distance (km)")
        ax.set_ylabel("Elevation (m)")
        ax.legend()

        return figure
Kind regards,
Vincent