I could already answer one question by myself about the top margin in
gridspec.
'''1) I would like to reduce the top margin. For that I though I can do
something like this:
gs = gridspec.GridSpec(2, 1, width_ratios=[2,1])
- gs.update(bottom=0.2, left=0.2, hspace=0.05)
+ gs.update(bottom=0.2, left=0.2, hspace=0.05, top=0.1)
But I get an error ""ValueError: bottom cannot be >= top"". This
limitation is not clear to me, why is this so?'''
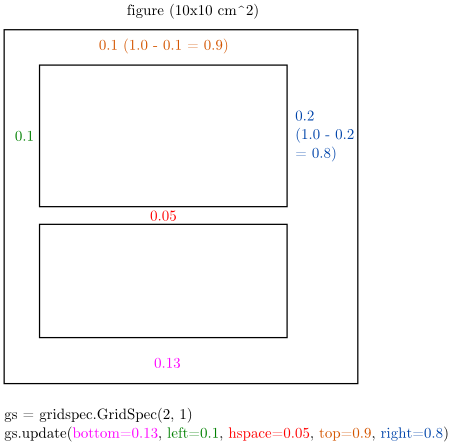
So if I want a top margin of 0.1*figure height I would have to specify
>>> top = 0.9
So "top" is the absolute distance of the top plot edge from the lower
figure edge. 1.0 would make the plot extend to the top edge.
Looking back I must say that
http://matplotlib.sourceforge.net/api/gridspec_api.html#matplotlib.gridspec.GridSpecBase
is not very helpful. And it is very counter-intuitive to the Axes
dimension specification with location lower left and width/height
>>> plt.axes([0.1, 0.1, 0.8, 0.8])
To clarify I created a small illustration.