Hi all,
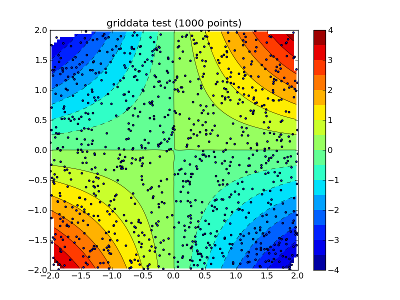
what is the reason for the white areas in the corners of the interpolation domain ?
Any idea ?
Nils
import numpy as np
from scipy.interpolate import griddata
import matplotlib.pyplot as plt
import numpy.ma as ma
from numpy.random import uniform, seed
# make up some randomly distributed data
seed(1234)
npts = 1000
x = uniform(-2,2,npts)
y = uniform(-2,2,npts)
z = x*y
# define grid.
xi = np.linspace(-2.3,2.3,100)
yi = np.linspace(-2.3,2.3,100)
# grid the data.
zi = griddata((x, y), z, (xi[None,:], yi[:,None]), method='cubic')
# contour the gridded data, plotting dots at the randomly spaced data points.
CS = plt.contour(xi,yi,zi,15,linewidths=0.5,colors='k')
CS = plt.contourf(xi,yi,zi,15,cmap=plt.cm.jet)
plt.colorbar() # draw colorbar
# plot data points.
plt.scatter(x,y,marker='o',c='b',s=5)
plt.xlim(-2,2)
plt.ylim(-2,2)
plt.title('griddata test (%d points)' % npts)
plt.show()