Hello
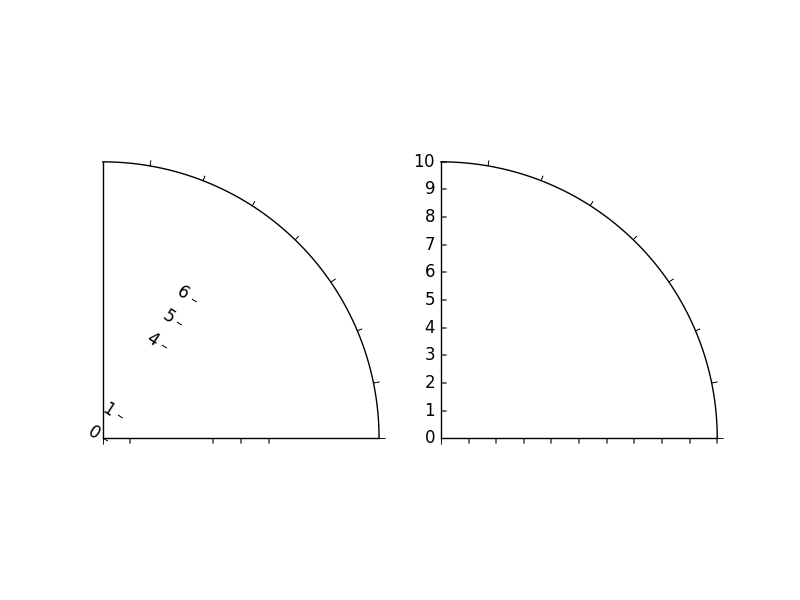
I am trying to change ticks in vertical axis of a Q1 polar plot. But ticks
are placed with some angle hard to understand... How can I fix this!?
code and fig follow attached
thanks
mm
-------------- next part --------------
An HTML attachment was scrubbed...
URL: <http://mail.python.org/pipermail/matplotlib-users/attachments/20151020/f94c8d9e/attachment-0001.html>
-------------- next part --------------
A non-text attachment was scrubbed...
Name: test_polar.png
Type: image/png
Size: 23081 bytes
Desc: not available
URL: <http://mail.python.org/pipermail/matplotlib-users/attachments/20151020/f94c8d9e/attachment-0001.png>
-------------- next part --------------
A non-text attachment was scrubbed...
Name: test_polar.py
Type: text/x-python
Size: 934 bytes
Desc: not available
URL: <http://mail.python.org/pipermail/matplotlib-users/attachments/20151020/f94c8d9e/attachment-0001.py>