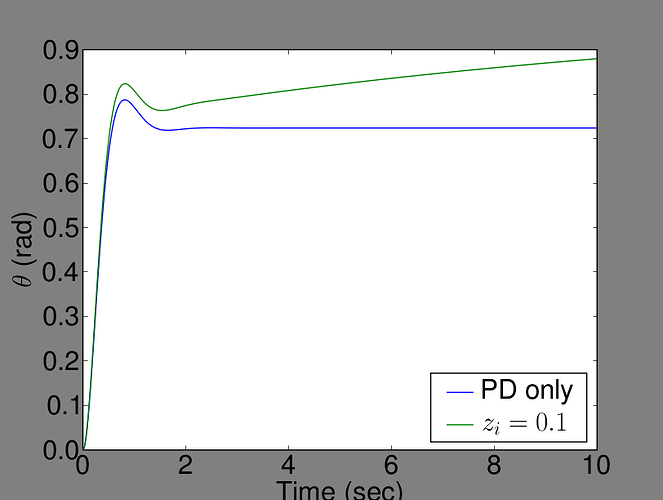
I have rebulit from SVN. It turns out that my problem only happens
with really large fonts. I am using Darren's new font size
specification with font.size = 18 or 24 and
everything else set to medium or large:
axes.titlesize : large # fontsize of the axes title
axes.labelsize : medium # fontsize of the x any y labels
xtick.labelsize : medium # fontsize of the tick labels
ytick.labelsize : medium # fontsize of the tick labels
legend.fontsize : medium
(I really like that new size scheme Darren.)
with font.size = 18, things are o.k. with 24, they are clipped on the
screen, in the pdf, and even a little in the png.
This may be closely related to what Steve just posted.
Ryan
with18pt.pdf (19.9 KB)
with24pt.pdf (20.1 KB)
···
On 3/6/06, Ryan Krauss <ryanlists@...287...> wrote:
The problem is in both. I will build from svn and see what happens.
Ryan
On 3/6/06, Darren Dale <dd55@...163...> wrote:
> Hi Ryan,
>
> On Monday 06 March 2006 5:50 pm, Ryan Krauss wrote:
> > I have a small problem when saving figures with
> > savefig.facecolor : gray #white # figure facecolor when saving
> > savefig.edgecolor : gray #white # figure edgecolor when saving
> > set in my rc file.
> >
> > If I run
> >
> > t=arange(0,1,0.1)
> > y=sin(2*pi*t)
> > plot(t,y)
> > xlabel('Time (sec)')
> > ylabel('amplitude')
> > savefig('gray.eps')
> >
> > and then epstopdf gray.eps, I get the attached file with the gray
> > border not going quite low enough. This doesn't occur when saving
> > .png. It also seems to be o.k. if I just use xlabel('time') without
> > the parenthesis and uppercase T.
> >
> > I am including the figures in a Latex beamer presenation with a dark
> > background and I need the gray border for visability.
> >
> > I tried switching to gs-8.50, but the problem didn't do away. I am
> > using version 0.86.2 which is probably cvs from a month ago.
>
> I cant reproduce your problem using the most recent checkout from svn. How
> does your eps file look, does the problem only exist in the pdf?
>
> Darren
>
>
> -------------------------------------------------------
> This SF.Net email is sponsored by xPML, a groundbreaking scripting language
> that extends applications into web and mobile media. Attend the live webcast
> and join the prime developer group breaking into this new coding territory!
> http://sel.as-us.falkag.net/sel?cmd=lnk&kid=110944&bid=241720&dat=121642
> _______________________________________________
> Matplotlib-users mailing list
> Matplotlib-users@lists.sourceforge.net
> matplotlib-users List Signup and Options
>
I think you will get better results by manually positioning your axes in the
figure window. MPL only knows to fill the specified figure window with the
gray background, but since your text runs over, it causes problems.
Darren
···
On Monday 06 March 2006 8:13 pm, Ryan Krauss wrote:
I have rebulit from SVN. It turns out that my problem only happens
with really large fonts. I am using Darren's new font size
specification with font.size = 18 or 24 and
everything else set to medium or large:
axes.titlesize : large # fontsize of the axes title
axes.labelsize : medium # fontsize of the x any y labels
xtick.labelsize : medium # fontsize of the tick labels
ytick.labelsize : medium # fontsize of the tick labels
legend.fontsize : medium
(I really like that new size scheme Darren.)
with font.size = 18, things are o.k. with 24, they are clipped on the
screen, in the pdf, and even a little in the png.
This may be closely related to what Steve just posted.
Following John's advice to Steve in the sister thread, I was able to
get really nice results by tweaking figure.subplot.bottom and .left:
font.size : 24.0
figure.subplot.left : 0.15 # the left side of the subplots of the figure
figure.subplot.right : 0.925 # the right side of the subplots of the figure
figure.subplot.bottom : 0.15 # the bottom of the subplots of the figure
figure.subplot.top : 0.925 # the top of the subplots of the figure
My rc file is attached as a starting point for people who like large
fonts (for when you have to shrink your figures into small places).
Ryan
matplotlibrc (11.3 KB)
···
On 3/6/06, Darren Dale <dd55@...163...> wrote:
On Monday 06 March 2006 8:13 pm, Ryan Krauss wrote:
> I have rebulit from SVN. It turns out that my problem only happens
> with really large fonts. I am using Darren's new font size
> specification with font.size = 18 or 24 and
> everything else set to medium or large:
> axes.titlesize : large # fontsize of the axes title
> axes.labelsize : medium # fontsize of the x any y labels
> xtick.labelsize : medium # fontsize of the tick labels
> ytick.labelsize : medium # fontsize of the tick labels
> legend.fontsize : medium
>
> (I really like that new size scheme Darren.)
>
> with font.size = 18, things are o.k. with 24, they are clipped on the
> screen, in the pdf, and even a little in the png.
>
> This may be closely related to what Steve just posted.
I think you will get better results by manually positioning your axes in the
figure window. MPL only knows to fill the specified figure window with the
gray background, but since your text runs over, it causes problems.
Darren
-------------------------------------------------------
This SF.Net email is sponsored by xPML, a groundbreaking scripting language
that extends applications into web and mobile media. Attend the live webcast
and join the prime developer group breaking into this new coding territory!
http://sel.as-us.falkag.net/sel?cmd=lnk&kid=110944&bid=241720&dat=121642
_______________________________________________
Matplotlib-users mailing list
Matplotlib-users@lists.sourceforge.net
matplotlib-users List Signup and Options
