Hi,
Following an hardware failure I had to move some matplotlib scripts from
an ancient (but updated) Debian box to a clean RHEL 6 VM. As a result my
matplotlib version changed from 1.2.0 (as present in Debian instable) to
1.2.1 (some of the code wanted matplotlib ≥ 1.0, so I rebuilt an 1.2.1
packaged based on the Fedora 1.2.0 one. 1.3.0-rc2 / 1.3.0git gave me so
many dependencies griefs I gave up on it)
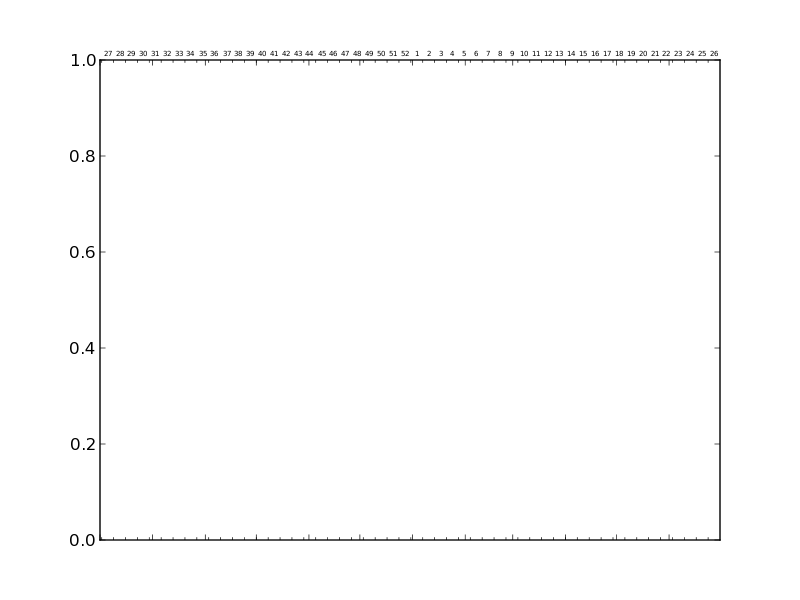
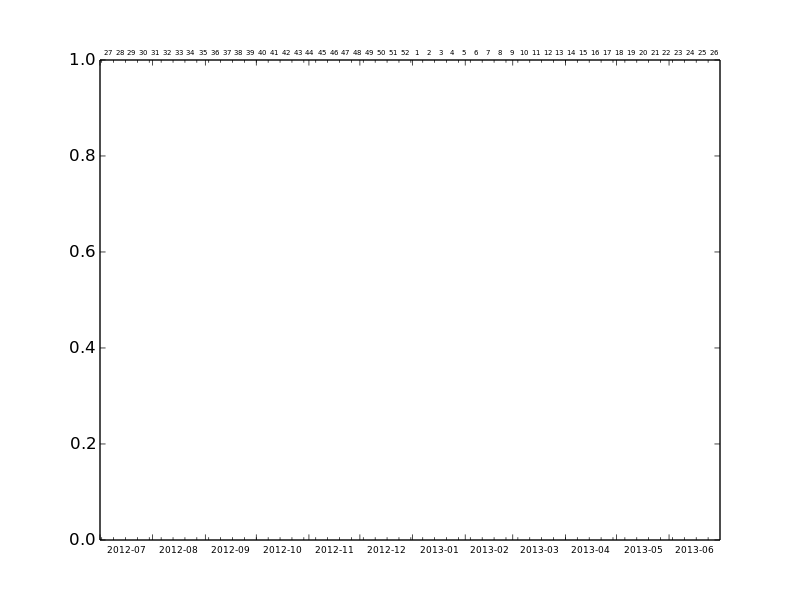
Anyway the result seems to work fine so far, except for a few scores of
time graphs where some tick labels gone missing. Those graphs are supposed
to show weekly data, with:
– ticks on month ends,
– subticks on week ends,
– week numbers in the middle of each week (top) and
– month numbers on the middle of each month (bottom).
With the new installation months numbers got missing.
Here is an extract of the relevant code :
%<---
subplot.set_xticks([dd.monthstart(m) for m in months])
subplot.set_xticks([w.gmticks() for w in weeks], minor=True)
subplot.set_xticklabels([])
plt.xlim(dd.monthstart(min(months)),dd.monthend(max(months)))
subplot1 = subplot.twiny()
mmonths = [m for i,m in enumerate(months)
if operator.mod(i,1+(len(months)-1)/12) == 0]
subplot1.set_xticks([dd.monthmiddle(m) for m in mmonths])
subplot1.set_xticklabels(mmonths)
subplot1.tick_params(labelsize='6.5',labelbottom=True, labeltop=False)
plt.xlim(dd.monthstart(min(months)),dd.monthend(max(months)))
subplot2 = subplot.twiny()
mweeks = [w for i,w in enumerate(weeks)
if operator.mod(i,1+(len(weeks)-1)/53) == 0]
subplot2.set_xticks([dd.weekmiddle(w) for w in mweeks])
subplot2.set_xticklabels([w.iso_week[1] for w in mweeks])
subplot2.tick_params(labelsize='5',labelbottom=False, labeltop=True,pad=3)
plt.xlim(dd.monthstart(min(months)),dd.monthend(max(months)))
subplot2.xaxis.set_ticks_position('none')
subplot1.xaxis.set_ticks_position('none')
subplot.xaxis.set_ticks_position('both')
%<---
I've tried to move the
subplot1.tick_params(labelsize='6.5',labelbottom=True, labeltop=False)
line to the end of the block, but it seems matplotlib is confusing
subplot1 and subplot2, and that results in the displaying of week numbers
(not month numbers) to the bottom of the plot (and the week numbers
disappear from the top of the graph).
Any idea how to restore the previously working behaviour ?
Regards,
···
--
Nicolas Mailhot