Hello,
Is it possible use a gradient color say from blue to red and/or specifying certain color threshold for a line plot (i.e I have air temperature plotted and I want to segment the color of the plot for temp > 0C red, and below 0 make it blue.) Would be much nicer with gradient however I am content for the second option as well 
Thanks.
···
–
Gökhan
The gradient, in general, is not supported by matplotlib yet.
If you're only interested in raster format outputs (like png), I
think you can use agg_filter functionality (but you need svn version
of mpl).
Other wise, I guess your best bet is to divide you line into many
segments and color them differently.
-JJ
···
On Sat, Sep 26, 2009 at 10:27 PM, Gökhan Sever <gokhansever@...287...> wrote:
Hello,
Is it possible use a gradient color say from blue to red and/or specifying
certain color threshold for a line plot (i.e I have air temperature plotted
and I want to segment the color of the plot for temp > 0C red, and below 0
make it blue.) Would be much nicer with gradient however I am content for
the second option as well 
Thanks.
--
Gökhan
------------------------------------------------------------------------------
Come build with us! The BlackBerry® Developer Conference in SF, CA
is the only developer event you need to attend this year. Jumpstart your
developing skills, take BlackBerry mobile applications to market and stay
ahead of the curve. Join us from November 9-12, 2009. Register now!
http://p.sf.net/sfu/devconf
_______________________________________________
Matplotlib-users mailing list
Matplotlib-users@lists.sourceforge.net
matplotlib-users List Signup and Options
The gradient, in general, is not supported by matplotlib yet.
If you’re only interested in raster format outputs (like png), I
think you can use agg_filter functionality (but you need svn version
of mpl).
Could you give me a pointer on this where to look for the agg_filter, since the search option doesn’t yield any helpful results.
I use the svn compiled matplotlib and docs.
Thanks.
···
On Sat, Sep 26, 2009 at 10:16 PM, Jae-Joon Lee <lee.j.joon@…287…> wrote:
Other wise, I guess your best bet is to divide you line into many
segments and color them differently.
-JJ
On Sat, Sep 26, 2009 at 10:27 PM, Gökhan Sever <gokhansever@…287…> wrote:
Hello,
Is it possible use a gradient color say from blue to red and/or specifying
certain color threshold for a line plot (i.e I have air temperature plotted
and I want to segment the color of the plot for temp > 0C red, and below 0
make it blue.) Would be much nicer with gradient however I am content for
the second option as well
Thanks.
–
Gökhan
Come build with us! The BlackBerry® Developer Conference in SF, CA
is the only developer event you need to attend this year. Jumpstart your
developing skills, take BlackBerry mobile applications to market and stay
ahead of the curve. Join us from November 9-12, 2009. Register now!
http://p.sf.net/sfu/devconf
Matplotlib-users mailing list
Matplotlib-users@lists.sourceforge.net
https://lists.sourceforge.net/lists/listinfo/matplotlib-users
–
Gökhan
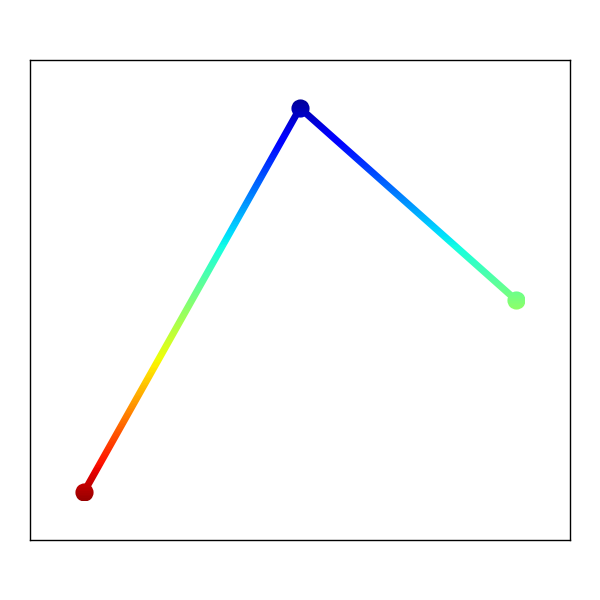
Take a look at the examples/pylab_examples/demo_agg_filter.py
Attached is a simple example that shows a line with gradient.
However, the current image filter does not know about the data
coordinate of the input image. Therefore, if you want to have your
gradient stops at certain data values, you need to specify this in
some manual way when you create the filter.
Maybe the second approach that I mentioned might be more reasonable.
Regards,
-JJ
demo_agg_filter2.py (1.66 KB)
···
On Sun, Sep 27, 2009 at 2:25 AM, Gökhan Sever <gokhansever@...287...> wrote:
On Sat, Sep 26, 2009 at 10:16 PM, Jae-Joon Lee <lee.j.joon@...287...> wrote:
The gradient, in general, is not supported by matplotlib yet.
If you're only interested in raster format outputs (like png), I
think you can use agg_filter functionality (but you need svn version
of mpl).
Could you give me a pointer on this where to look for the agg_filter, since
the search option doesn't yield any helpful results.
I use the svn compiled matplotlib and docs.
Thanks.
Other wise, I guess your best bet is to divide you line into many
segments and color them differently.
-JJ
On Sat, Sep 26, 2009 at 10:27 PM, Gökhan Sever <gokhansever@...985.....> >> wrote:
> Hello,
>
> Is it possible use a gradient color say from blue to red and/or
> specifying
> certain color threshold for a line plot (i.e I have air temperature
> plotted
> and I want to segment the color of the plot for temp > 0C red, and below
> 0
> make it blue.) Would be much nicer with gradient however I am content
> for
> the second option as well
>
> Thanks.
>
> --
> Gökhan
>
>
> ------------------------------------------------------------------------------
> Come build with us! The BlackBerry® Developer Conference in SF, CA
> is the only developer event you need to attend this year. Jumpstart your
> developing skills, take BlackBerry mobile applications to market and
> stay
> ahead of the curve. Join us from November 9-12, 2009. Register
> now!
> http://p.sf.net/sfu/devconf
> _______________________________________________
> Matplotlib-users mailing list
> Matplotlib-users@lists.sourceforge.net
> matplotlib-users List Signup and Options
>
>
--
Gökhan
Take a look at the examples/pylab_examples/demo_agg_filter.py
Attached is a simple example that shows a line with gradient.
However, the current image filter does not know about the data
coordinate of the input image. Therefore, if you want to have your
gradient stops at certain data values, you need to specify this in
some manual way when you create the filter.
Maybe the second approach that I mentioned might be more reasonable.
Agree. That first code is not an easy bite for me. I can tackle the second one easily.
Thanks for the advice and pointers
···
On Sun, Sep 27, 2009 at 3:04 PM, Jae-Joon Lee <lee.j.joon@…287…> wrote:
Regards,
-JJ
On Sun, Sep 27, 2009 at 2:25 AM, Gökhan Sever <gokhansever@…287…> wrote:
On Sat, Sep 26, 2009 at 10:16 PM, Jae-Joon Lee <lee.j.joon@…287…> wrote:
The gradient, in general, is not supported by matplotlib yet.
If you’re only interested in raster format outputs (like png), I
think you can use agg_filter functionality (but you need svn version
of mpl).
Could you give me a pointer on this where to look for the agg_filter, since
the search option doesn’t yield any helpful results.
I use the svn compiled matplotlib and docs.
Thanks.
Other wise, I guess your best bet is to divide you line into many
segments and color them differently.
-JJ
On Sat, Sep 26, 2009 at 10:27 PM, Gökhan Sever <gokhansever@…287…> > > >> wrote:
Hello,
Is it possible use a gradient color say from blue to red and/or
specifying
certain color threshold for a line plot (i.e I have air temperature
plotted
and I want to segment the color of the plot for temp > 0C red, and below
0
make it blue.) Would be much nicer with gradient however I am content
for
the second option as well
Thanks.
–
Gökhan
Come build with us! The BlackBerry® Developer Conference in SF, CA
is the only developer event you need to attend this year. Jumpstart your
developing skills, take BlackBerry mobile applications to market and
stay
ahead of the curve. Join us from November 9-12, 2009. Register
now!
http://p.sf.net/sfu/devconf
Matplotlib-users mailing list
Matplotlib-users@lists.sourceforge.net
https://lists.sourceforge.net/lists/listinfo/matplotlib-users
–
Gökhan
–
Gökhan