Hey guys, I am following the scatter plot code here. Then it ran into error get_sample_data() got an unexpected keyword argument 'np_load'.
I am using numpy version 1.15.0 & matplotlib 3.0.3. Thank you in advance.
Hey guys, I am following the scatter plot code here. Then it ran into error get_sample_data() got an unexpected keyword argument 'np_load'.
I am using numpy version 1.15.0 & matplotlib 3.0.3. Thank you in advance.
Welcome HaFred !!!
Could you post the code ?
Rgds.
import numpy as np
import matplotlib.pyplot as plt
import matplotlib.cbook as cbook

# Load a numpy record array from yahoo csv data with fields date, open, close,
# volume, adj_close from the mpl-data/example directory. The record array
# stores the date as an np.datetime64 with a day unit ('D') in the date column.
price_data = (cbook.get_sample_data('goog.npz', np_load=True)['price_data']
              .view(np.recarray))
price_data = price_data[-250:]  # get the most recent 250 trading days

delta1 = np.diff(price_data.adj_close) / price_data.adj_close[:-1]

# Marker size in units of points^2
volume = (15 * price_data.volume[:-2] / price_data.volume[0])**2
close = 0.003 * price_data.close[:-2] / 0.003 * price_data.open[:-2]

fig, ax = plt.subplots()
ax.scatter(delta1[:-1], delta1[1:], c=close, s=volume, alpha=0.5)

ax.set_xlabel(r'$\Delta_i$', fontsize=15)
ax.set_ylabel(r'$\Delta_{i+1}$', fontsize=15)
ax.set_title('Volume and percent change')

ax.grid(True)
fig.tight_layout()

plt.show()
FYI, basically I just follow the matplotlib document. Thanks a lot.
Well I could not figure out this error, my installation of Matplotlib (Anaconda) is not working very well - I cannot even get the last version of Matplotlib.
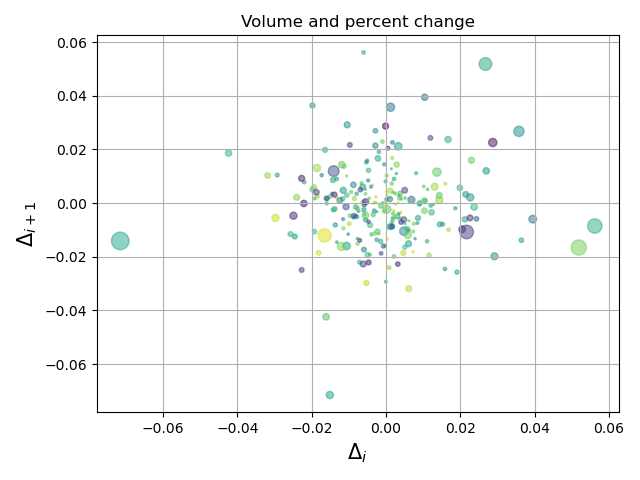
But I got the data in another way using Pandas Datareader :
import numpy as np
import matplotlib.pyplot as plt
import pandas_datareader as pdr
price_data = pdr.DataReader(‘GOOG’,‘stooq’)
price_data = price_data[-250:] # get the most recent 250 trading days
delta1 = np.diff(price_data.Close) / price_data.Close[:-1]
volume = (15 * price_data.Volume[:-2] / price_data.Volume[0])**2
close = 0.003 * price_data.Close[:-2] / 0.003 * price_data.Open[:-2]
fig, ax = plt.subplots()
ax.scatter(delta1[:-1], delta1[1:], c=close, s=volume, alpha=0.5)
ax.set_xlabel(r’\Delta_i‘, fontsize=15)
ax.set_ylabel(r’\Delta_{i+1}', fontsize=15)
ax.set_title(‘Volume and percent change’)
ax.grid(True)
fig.tight_layout()
plt.show()
But there are some differences : This database does no have adjusted close price, so I used the close price.
This is not what you request, but I hope it might help.
For sure later this error message will be properly solved.
Rgds.
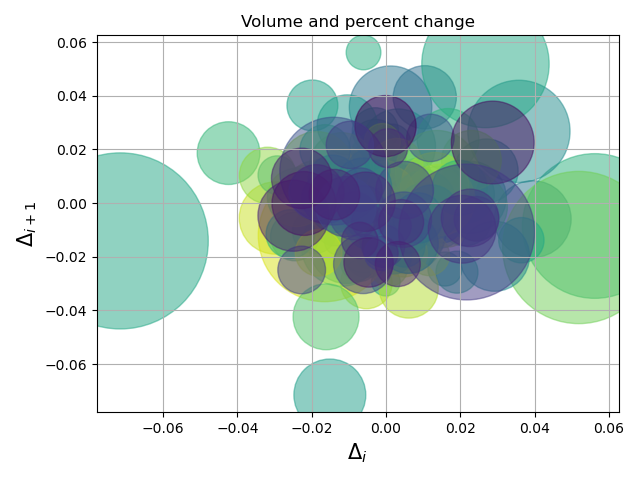
Thanks a lot, El_Uatu! This seems like a zoom in plot for GOOG data, I am wondering do you know how to zoom out and make the range for both x, y axis larger like in the document?
Your answer really helps me a lot. Thanks again.
Well, since I cannot see the data of the original plot to compare to the data used, I guessed and divided the volume (size) per 100.
ax.scatter(delta1[:-1], delta1[1:], c=close, s=volume/100, alpha=0.5)
And got :
I think you need to either update to matplotlib v3.3 or remove the np_load kwargs from your local copy of the example
I could not find anything like " np_load= True " that can be given as an attribute, so your code should something like:
price_data_file = cbook.get_sample_data(‘goog.npz’, asfileobj=False)
data = np.load(price_data_file)
z = data [‘price_data’]
in order to access the data, and after that you can access what you want.