Flock1
September 18, 2022, 5:19am
1
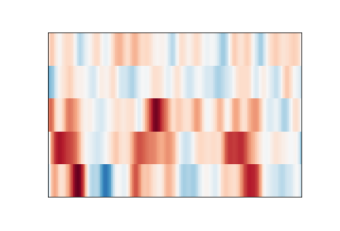
I want to get rid of white spaces from this plot. The plot is from mne library example here . I only want to data in the box and nothing else. I converted the plot to image like this:
def get_img_from_fig(fig, dpi=180):
    buf = io.BytesIO()
    fig.savefig(buf, format="png", dpi=fig.dpi)
    buf.seek(0)
    img_arr = np.frombuffer(buf.getvalue(), dtype=np.uint8)
    buf.close()
    img = cv2.imdecode(img_arr, 1)
    img = cv2.cvtColor(img, cv2.COLOR_BGR2RGB)
    return img
plt.axis('off')
plt.imshow(img_orig_2)
plt.savefig('test.png', bbox_inches='tight',pad_inches = 0, dpi = 180)
plt.show()
but it won’t get rid of the white space. What should I do besides manually cropping or setting the aspect ratio?
cameron
September 18, 2022, 7:19am
2
My current recipe is this remove_decorations function:
                    )
                else:
                  dpi = FigureSize.DEFAULT_DPI
                # make a figure and choose the Axes from it
                figure = Figure(figsize=(fig_dx, fig_dy), dpi=dpi, **fig_kw)
                figure.add_subplot()
              # pylint: disable=unsubscriptable-object
              ax = figure.axes[ax]
            return ax

          @typechecked
          def remove_decorations(figure_or_ax: Union[Figure, Axes]):
            ''' Remove all decorations from a `Figure` or `Axes` instance,
                intended for making bare plots such as a tile in GUI.

                Presently this removes:
                - axes markings and legend from each axis
                - the padding from all the figure subplots
            '''
            if isinstance(figure_or_ax, Axes):
              axs = (figure_or_ax,)
I have no idea if it is sufficiently complete. You have to do thisafter all the plotting but before you show or save the plot.
Cheers,cs@cskk.id.au
···
On 18Sep2022 05:29, Flock-Anizak via Matplotlib nobody@discourse.matplotlib.org wrote:
I want to get rid of white spaces from this plot. The plot is frommne library examplehere .
1 Like
Flock1
September 18, 2022, 5:40pm
3
Is there a way I can do this in python? How do I use this when I’m training a machine learning model?
cameron
September 18, 2022, 9:12pm
4
That function is is Python. Here’s an example use of it:
                ],
                ax=power_ax,
                tz=tz,
            )
            power_ax.legend()
            ax2.legend()
          else:
            plot_data = []
            while data_specs:
              plot_data.extend(self.popdata(start, stop, data_specs, tz=tz))
            figure = spd.plot(
                start,
                stop,
                plot_data,
                tz=tz,
                event_labels=event_labels,
                stacked=stacked,
            )
          if bare:
            remove_decorations(figure)
          if imgpath:
Ignoring the larger programme, the line:
figure = spd.plot(.......)
returns a matplotlib Figure containing a plot of my solar inverter
 if bare:
       remove_decorations(figure)
removes the decoarations from the figure if that mode has been selected.
Your example code:
 def get_img_from_fig(fig, dpi=180):
     buf = io.BytesIO()
     fig.savefig(buf, format="png", dpi=fig.dpi)
     .....
appears to my eye to save a Figure to a BytesIO instance. You’d callremove_decorations(fig) just before fig.savefigure(...).
As I understand matplotlib’s model, a Figure is a representation ofFigure. ThatFigure to remove decoations like legends
Cheers,cs@cskk.id.au
···
On 18Sep2022 17:50, Flock-Anizak via Matplotlib nobody@discourse.matplotlib.org wrote:
Is there a way I can do this in python? How do I use this when I’m
