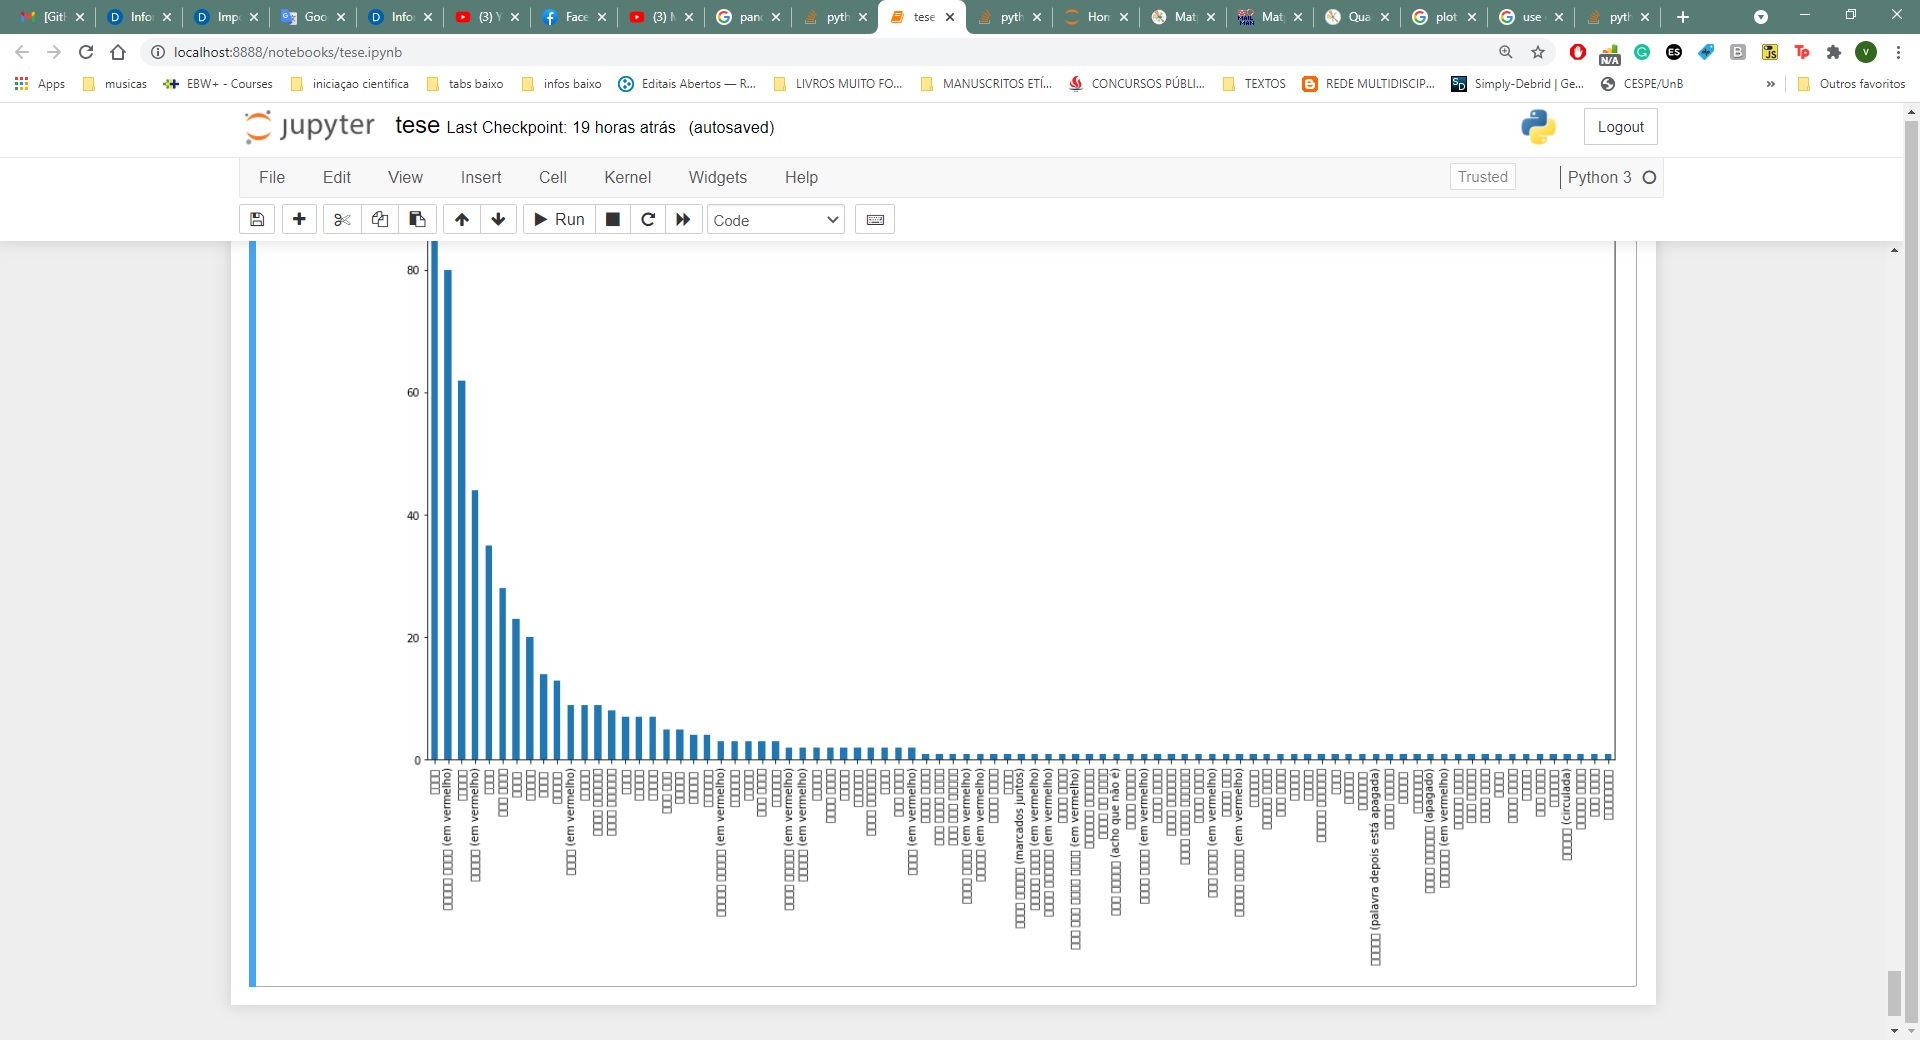
I created a plot to see the number of occurrences of a term in my data. The problem is that the terms are written in ge’ez, and old Ethiopian language. When I plot they are not recognized. I believe the image attached will help to clarify what I am saying. Is there anything I can do so they appear in the plot?
Problem solved:
import matplotlib.pyplot as plt
plt.rcParams[‘font.sans-serif’]=[‘Nyala’] #Show Ethiopian label
plt.rcParams[‘axes.unicode_minus’]=False #These two lines need to be set manually
2 Likes
@vitorcunha94 I’m glad you sorted this out!
For refernece, see Text properties and layout — Matplotlib 3.4.2 documentation for more notes about how to find and set the correct fonts for scripts not supported by dejavu.
1 Like