Finding the Supposed MPL show() "bug".

I chronicled some of my MPL problems here. It appeared that show() could be the problem. The problem is apparently the difference between running the program in IDLE and executing it from the folder (Maybe there's a name for that?). There are only about 8 lines of MPL code to the show() in a def. I inserted and moved a return down each line, executing the program afterwords. It behaved as expected, no plot. Once I removed the plot, I got the unexpected behavior. A video clip not played. So off to a direct py file execution. It worked fully.

What this amounts to is that we need to find a better way for users to execute the program than through IDLE. Tomorrow I'll pass this by the original developer.

···

--
"Crime is way down. War is declining. And that's far from the good news." -- Steven Pinker (and other sources) Why is this true, but yet the media says otherwise? The media knows very well how to manipulate us (see limbic, emotion, $$). -- WTW

Foiled again. I clicked on the previous version, which has no MPL code in the same def.
The show() is where things go wrong though. The question now is where did the program go after the show()? Maybe it's time to put the interactive debugger into play, which I've barely used. I have used others.

···

On 2/10/2010 6:44 PM, Wayne Watson wrote:

I chronicled some of my MPL problems here. It appeared that show() could be the problem. The problem is apparently the difference between running the program in IDLE and executing it from the folder (Maybe there's a name for that?). There are only about 8 lines of MPL code to the show() in a def. I inserted and moved a return down each line, executing the program afterwords. It behaved as expected, no plot. Once I removed the plot, I got the unexpected behavior. A video clip not played. So off to a direct py file execution. It worked fully.

What this amounts to is that we need to find a better way for users to execute the program than through IDLE. Tomorrow I'll pass this by the original developer.

--
"Crime is way down. War is declining. And that's far from the good news." -- Steven Pinker (and other sources) Why is this true, but yet the media says otherwise? The media knows very well how to manipulate us (see limbic, emotion, $$). -- WTW

A Ground Hog movie moment? Deja vu all over again (Quoting Yega Berra.).

I went right through John Hunter's comment of a day or two ago about the need to solve this with ipython. That has to be taken into consideration; otherwise, this is a no-go..

I suppose an interesting aside though on what I discovered through the debugger. When the program hit show(), it went back to the first line in the calling def instead of after where it was called. I suppose in some dim way one could use a global variable to detect that occurrence, and remedy matters. I'll defer to ipython.

···

On 2/10/2010 7:08 PM, Wayne Watson wrote:

Foiled again. I clicked on the previous version, which has no MPL code
in the same def.
The show() is where things go wrong though. The question now is where
did the program go after the show()? Maybe it's time to put the
interactive debugger into play, which I've barely used. I have used others.

On 2/10/2010 6:44 PM, Wayne Watson wrote:
   

I chronicled some of my MPL problems here. It appeared that show()
could be the problem. The problem is apparently the difference between
running the program in IDLE and executing it from the folder (Maybe
there's a name for that?). There are only about 8 lines of MPL code to
the show() in a def. I inserted and moved a return down each line,
executing the program afterwords. It behaved as expected, no plot.
Once I removed the plot, I got the unexpected behavior. A video clip
not played. So off to a direct py file execution. It worked fully.

What this amounts to is that we need to find a better way for users to
execute the program than through IDLE. Tomorrow I'll pass this by the
original developer.
     
--
"Crime is way down. War is declining. And that's far from the good news." -- Steven Pinker (and other sources) Why is this true, but yet the media says otherwise? The media knows very well how to manipulate us (see limbic, emotion, $$). -- WTW

Instead of focusing on "show", you should describe the problem you are
trying to solve. From previous posts, it sounds like you are trying
to use pyplot in a mode is was not designed to handle. You said you
are delivering a python application that uses matplotlib to users who
do not know python, and using Idle to run the app. Why? Why use idle
in an app for users who do not know python since it is a python IDE.
You also said that this was not your design decision and so it sounds
like you are working on code someone else developed so you may be
suffering from someone else's bad design decisions.

My guess is you would have much more success embedding matplotlib in a
GUI toolkit of your choice and then you have complete control over the
mainloop, the threading, how and when windows are raised in what
order.

http://matplotlib.sourceforge.net/examples/user_interfaces/index.html

"show" is meant to be the last line of a script and raise all of the
figures generated in that script at once. interactive mode including
ipython in pylab mode is meant for python coders who want to create
and modify figures typing python code at the interactive shell prompt.
User interface embedding is for developers who want to deploy mpl in
an application to users who may or may not know python where the
developer wants complete control of figure and window management --
this sounds like your use case. Trying to shoehorn one mode into
another will lead to frustration.

Writing user interface applications can be hard and tedious (though
there are tools like enthought traits to make it less so). pyplot is
technically a user interface application which is a scripting language
to make figures. Because it is easy, some people who want to write
more complex applications only using pyplot and this can be done up to
a point with judicious use of event handling and GUI idle handlers,
etc (see http://matplotlib.sourceforge.net/users/event_handling.html).
But at some point you will hit the wall because you are trying to
make pyplot do something it is not designed to do, but don't blame
pyplot (or pyplot.show). matplotlib is readily usable in complex user
interface applications -- in fact that is what it was designed for --
and pyplot is just an interface sitting on top of that, but you must
use the matplotlib API and directly embed the matplotlib canvas and
toolbar in your application to reach this potential.

JDH

···

On Thu, Feb 11, 2010 at 2:41 AM, Wayne Watson <sierra_mtnview@...209...> wrote:

A Ground Hog movie moment? Deja vu all over again (Quoting Yega Berra.).

I went right through John Hunter's comment of a day or two ago about the
need to solve this with ipython. That has to be taken into
consideration; otherwise, this is a no-go..

Yes, certainly,as you explained a few days ago, the present use is incompatible with idle usage. Further, you mentioned the need for ipython and the "backend" to make it work (in IDLE?). The way we are using problem seems a bit ambiguous, so let me tell what I want the application to do.

Overall, the software,in Python 2.5 for Win and some i/f to hw/w, provides the mechanism to capture fireballs, bright meteors, with a video camera. The software is mostly about the camera. When to turn it on/off for the night, etc. There is only one minimal analytic capability, which uses MPL to produce a brightness curve for a meteor.

   During the day, a station operator examines the take for the night by successively moving from meteor event to another via software buttons. As this is done, the video of the meteor appears on the screen. Someone else, probably a summer student, put the brigthness curve in a few years ago. I have a station and have been perplexed as to why more analytic capability than that has never been supplied. Having some past experience with software, I decided to put in a new analytic capability.

It is supposed to do this. For each video the user sees, I want to generate statistics on the meteor track, and a plot (MPL style) showing the track across a 640x480 area. Not the meteor itself, but the centroid of tracks along the path. Both the stats and plot work, except for one thing. When show(), say in def do_track_stats, is executed the plot appears,but does not return to the statement after the call from which the plot def, call it def setup_trks, was called. As a consequence, the calling def setup_trks does not bump ahead to the next video,which is the next thing it should do. The first image shown remains on the display screen. The stats for the video do get calculated properly and displayed in the shell script. That's the (software) problem, the video never changes. As I think I discovered with the debugger, after show() finishes, the program goes to the start of setup_trks.

Fortunately, I have access to the fellow to originally developed this application. I will write him shortly and ask him if he has another way to use and execute the program. I have not one single idea why it operates this way. Well, perhaps. When I talked to him several years ago about modifying some of the code, and asked for advice on an interpreter, he said he only has experience with IDLE, so in my work, which is pretty much independent now of his, I 've stuck with it. In the last five years I've seen this app go from C (Linux) to Windows + Linux to sometime this year to C++. They've been taking advantage of newly developed capture cards. Although I used to know C++ very well, I'm not going there. Now that I've invested a good bit of time in Python, I'm sticking with it. I can write all the analytic code I need by understanding whatever the data files the C++ might produce. Basically, it's just a tool to shoot videos. The original developer does really produce good code in each of these instances, but it is undocumented, and has been problematic sometimes, especially with the h/w hooks in it. I do talk to the fellow pretty regularly, but about new ideas for the C++ s/w. The new camera capabilities are pretty impressive.

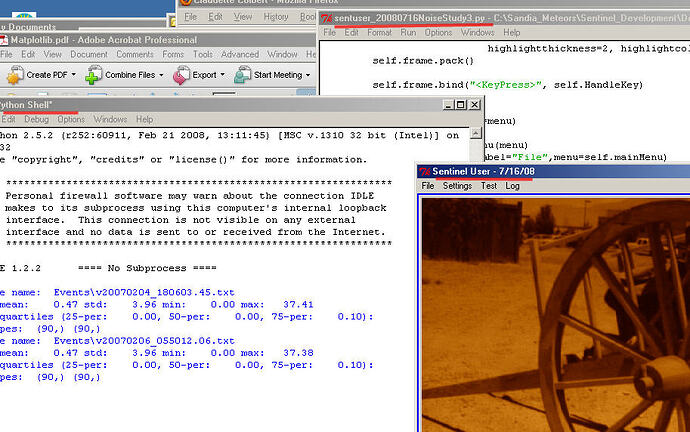
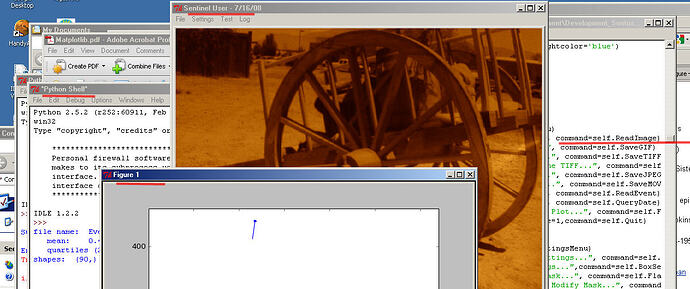
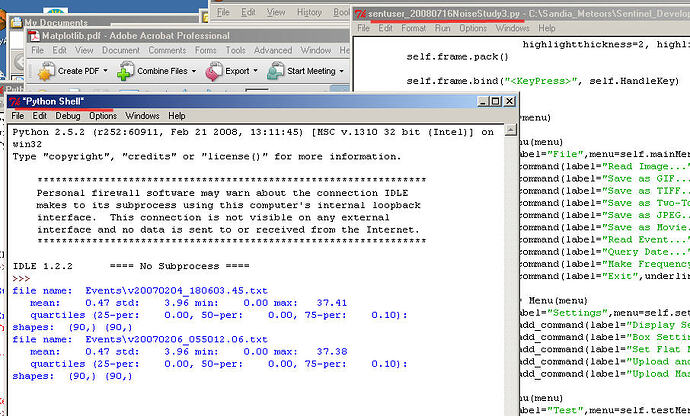
I'm going to attach I made for another follower of my trials and tribulations. They may not help,but might. The red lines show which windows are active for the app. Other windows just happen to be in use for other purposes. Note a wagon wheel is shown where the meteor video goes. It's the first thing in the window, but never changes, as the bump to next doesn't work,as above.

There are other i/f issues, but, another time, to do with the shell window.

···

On 2/11/2010 3:24 AM, John Hunter wrote:

On Thu, Feb 11, 2010 at 2:41 AM, Wayne Watson > <sierra_mtnview@...209...> wrote:

A Ground Hog movie moment? Deja vu all over again (Quoting Yega Berra.).

I went right through John Hunter's comment of a day or two ago about the
need to solve this with ipython. That has to be taken into
consideration; otherwise, this is a no-go..

Instead of focusing on "show", you should describe the problem you are
trying to solve. From previous posts, it sounds like you are trying
to use pyplot in a mode is was not designed to handle. You said you
are delivering a python application that uses matplotlib to users who
do not know python, and using Idle to run the app. Why? Why use idle
in an app for users who do not know python since it is a python IDE.
You also said that this was not your design decision and so it sounds
like you are working on code someone else developed so you may be
suffering from someone else's bad design decisions.

My guess is you would have much more success embedding matplotlib in a
GUI toolkit of your choice and then you have complete control over the
mainloop, the threading, how and when windows are raised in what
order.

http://matplotlib.sourceforge.net/examples/user_interfaces/index.html

"show" is meant to be the last line of a script and raise all of the
figures generated in that script at once. interactive mode including
ipython in pylab mode is meant for python coders who want to create
and modify figures typing python code at the interactive shell prompt.
  User interface embedding is for developers who want to deploy mpl in
an application to users who may or may not know python where the
developer wants complete control of figure and window management --
this sounds like your use case. Trying to shoehorn one mode into
another will lead to frustration.

Writing user interface applications can be hard and tedious (though
there are tools like enthought traits to make it less so). pyplot is
technically a user interface application which is a scripting language
to make figures. Because it is easy, some people who want to write
more complex applications only using pyplot and this can be done up to
a point with judicious use of event handling and GUI idle handlers,
etc (see http://matplotlib.sourceforge.net/users/event_handling.html).
  But at some point you will hit the wall because you are trying to
make pyplot do something it is not designed to do, but don't blame
pyplot (or pyplot.show). matplotlib is readily usable in complex user
interface applications -- in fact that is what it was designed for --
and pyplot is just an interface sitting on top of that, but you must
use the matplotlib API and directly embed the matplotlib canvas and
toolbar in your application to reach this potential.

JDH

--
"Crime is way down. War is declining. And that's far from the good news." -- Steven Pinker (and other sources) Why is this true, but yet the media says otherwise? The media knows very well how to manipulate us (see limbic, emotion, $$). -- WTW

from idle. If you are trying to integrate pyplot with this, it is a
mode of usage that is *explicitly not supported*. Rather, you should
embed matplotlib in the app following the embedding_in_tk*.py examples
at

http://matplotlib.sourceforge.net/examples/user_interfaces/index.html

JDH

···

On Thu, Feb 11, 2010 at 9:18 AM, Wayne Watson <sierra_mtnview@...209...> wrote:

Yes, certainly,as you explained a few days ago, the present use is
incompatible with idle usage. Further, you mentioned the need for ipython
and the "backend" to make it work (in IDLE?). The way we are using problem
seems a bit ambiguous, so let me tell what I want the application to do.

From the screenshots, this appears to be a tk app that is being run

Definitely tkinter. I’ll look at the link. Interestingly though, and I
think I mentioned this. There is another plot that’s been working
fine. I seldom use it, but when I have, it seems to work.

The developer stated this in a msg this morning.

Either
way should work. Double clicking the py file is probably more
convenient, but you can more easily see error messages if you open it
with IDLE

···

<sierra_mtnview@…209…>http://matplotlib.sourceforge.net/examples/user_interfaces/index.html

“Crime is way down. War is declining. And that’s far from the good
news.” – Steven Pinker (and other sources)
Why is this true, but yet the media says otherwise? The media
knows very well how to manipulate us (see limbic, emotion, $$). – WTW

That link has no reference to tkinter. tk and tk2, plus a few others
with tk in their names, but nothing else.A search in the box produced
nothing.

···

<sierra_mtnview@…209…>http://matplotlib.sourceforge.net/examples/user_interfaces/index.html

“Crime is way down. War is declining. And that’s far from the good
news.” – Steven Pinker (and other sources)
Why is this true, but yet the media says otherwise? The media
knows very well how to manipulate us (see limbic, emotion, $$). – WTW


http://p.sf.net/sfu/solaris-dev2dev


Matplotlib-users@lists.sourceforge.nethttps://lists.sourceforge.net/lists/listinfo/matplotlib-users

“Crime is way down. War is declining. And that’s far from the good
news.” – Steven Pinker (and other sources)
Why is this true, but yet the media says otherwise? The media
knows very well how to manipulate us (see limbic, emotion, $$). – WTW

As I said in my last email, the embedding_in_tk* files are the ones you want.

JDH

···

On Thu, Feb 11, 2010 at 10:42 AM, Wayne Watson <sierra_mtnview@...209...> wrote:

That link has no reference to tkinter. tk and tk2, plus a few others with
tk in their names, but nothing else.A search in the box produced nothing.

Thanks. Got detoured by "not supported". I think I'll be printing our your messages in the future. I just went back to one just now, and had forgotten about your mentio of pyLab, model.

···

On 2/11/2010 7:38 AM, John Hunter wrote:

On Thu, Feb 11, 2010 at 9:18 AM, Wayne Watson > <sierra_mtnview@...209...> wrote:
   

Yes, certainly,as you explained a few days ago, the present use is
incompatible with idle usage. Further, you mentioned the need for ipython
and the "backend" to make it work (in IDLE?). The way we are using problem
seems a bit ambiguous, so let me tell what I want the application to do.
     

> From the screenshots, this appears to be a tk app that is being run
from idle. If you are trying to integrate pyplot with this, it is a
mode of usage that is *explicitly not supported*. Rather, you should
embed matplotlib in the app following the embedding_in_tk*.py examples
at

http://matplotlib.sourceforge.net/examples/user_interfaces/index.html

JDH

--
"Crime is way down. War is declining. And that's far from the good news." -- Steven Pinker (and other sources) Why is this true, but yet the media says otherwise? The media knows very well how to manipulate us (see limbic, emotion, $$). -- WTW

Why? Just call it from the command line
of a console window that you will leave open.
(Or write the error to file.)

Alan Isaac

···

On 2/11/2010 11:36 AM, Wayne Watson wrote:

you can more easily see error messages if you open it with IDLE

http://matplotlib.sourceforge.net/examples/user_interfaces/embedding_in_tk.html

Read down a half dozen lines or so.

Alan Isaac

···

On 2/11/2010 11:42 AM, Wayne Watson wrote:

That link has no reference to tkinter

Wayne Watson wrote:

The developer stated this in a msg this morning.
Either way should work. Double clicking the py file is probably more convenient, but you can more easily see error messages if you open it with IDLE

option 3:
   Start it up in a command window (DOS box on Windows), and then you won't have the mainloop interaction issues, and you'll see the output.

open a dos box, cd to the directory where your script is, and type:

python name_of_script.

If it can't find python, then you need to tell it where to look by adding it to your PATH or typing the whole thing:

C:\Python25\bin\python.exe

or something like that (not on Windows at the moment)

Note that this is not an MPL issue it is an IDLE (and many other IDEs) issue -- any Python IDE that runs your code in the same process as the IDE itself is going to have these issues.

IPython has gone to great pains to make interactive use with GUI programs work -- I don't any other tool that has.

Wayne Watson wrote:

That link has no reference to tkinter. tk and tk2, plus a few others with tk in their names, but nothing else.A search in the box produced nothing.

tkinter is the python binding to the Tk GUI toolkit -- so tkiniter and tk mean about the same thing when talking about Python.

Wayne Watson wrote:

Thanks for the info. I'm semi-resistant to ipython. I tried if for a few hours, and it seemed a bit too much like linux.

ipython is an interactive command line interface to Python -- it is much nicer than the raw interpreter, but it is what it is, and it is very good at it. It can be very helpful to experiment with stuff in an interactive environment, but once you go beyond tiny stuff, you need to write a program. To do that you need an editor, and a wya to run and debug it. An IDE integrates these functions, and there are many of them.

Personally, I use an editor to edit the code, the commend line (or IPython) to run the code, and do most of my debugging with print statements.

I suggest you take a bit of a break from the problem at hand, and go through a couple intro tutoroal sit python, write a couple small programs (tkinter-based, if that's what you're going to need), and get a handle on how to do it.

lot, and enjoyed it. I'll consider it. Windows is the game now.

frankly, not all that different from a programming in Python point of view.

Yes, actual use is good, but the needed imports seem a bit baffling. scipy, pylab, matplotlib, ...? What components do I only need for a particular use?

you need what you need -- you need numpy for amost eveything you'll ever do if you work with numbers. You need matplotlib if you need to plot, you need scipy if you need any of the more complicated numerical routines it provides. pyplot dumps a bunch of these into the same namespace, which is nice for interactive use, but I"d stay away from it for writing programs.

Wayne Watson wrote:

I'm assuming that I don't
want to use import matplotlib a lot, but something selectively like from matplotlib.image import AxesImage, or from matplotlib.plot import figure, show. What did I miss in my Python upbringing?

It's really a matter of taste. YOu either do:

import matplotlib

fig = matplotlib.figure

or from matplotlib import figure

fig = figure.

You'll need a lot of things in matplotlib if you're doing much of anything, and "namespaces are one honking great idea", so I do:

import matplotlib as mpl

fig = mpl.figure()

etc..

HTH,

-Chris

···

--
Christopher Barker, Ph.D.
Oceanographer

Emergency Response Division
NOAA/NOS/OR&R (206) 526-6959 voice
7600 Sand Point Way NE (206) 526-6329 fax
Seattle, WA 98115 (206) 526-6317 main reception

Chris.Barker@...259...