Hello everyone:
My question is not only about matplotlib, but I wonder if I can do what I want with some matplotlib subroutine, instead of the one for scipy.
I’m new using scipy, so I’m sorry if any of my questions are silly.
I’m trying to find the maxima, absolut and local, of a function, in order to
fit an exponencial curve and get de exponecial argument.
My function if the soluction of a couple equations system:
···
def derivs3(x,t,gamma,omega,dl):
d1 = omegax[2] - gamma x[0]
d2 = dlx[2] - (gamma/2.) x[1]
d3 = -omega x[0] - dlx[1] - (gamma/2.)* x[2] + (omega/2.)
return d1,d2,d3
def solucion(a,t,gamma, omega, dl):
sol=odeint(derivs3,a,t,(gamma,omega,dl))
return sol
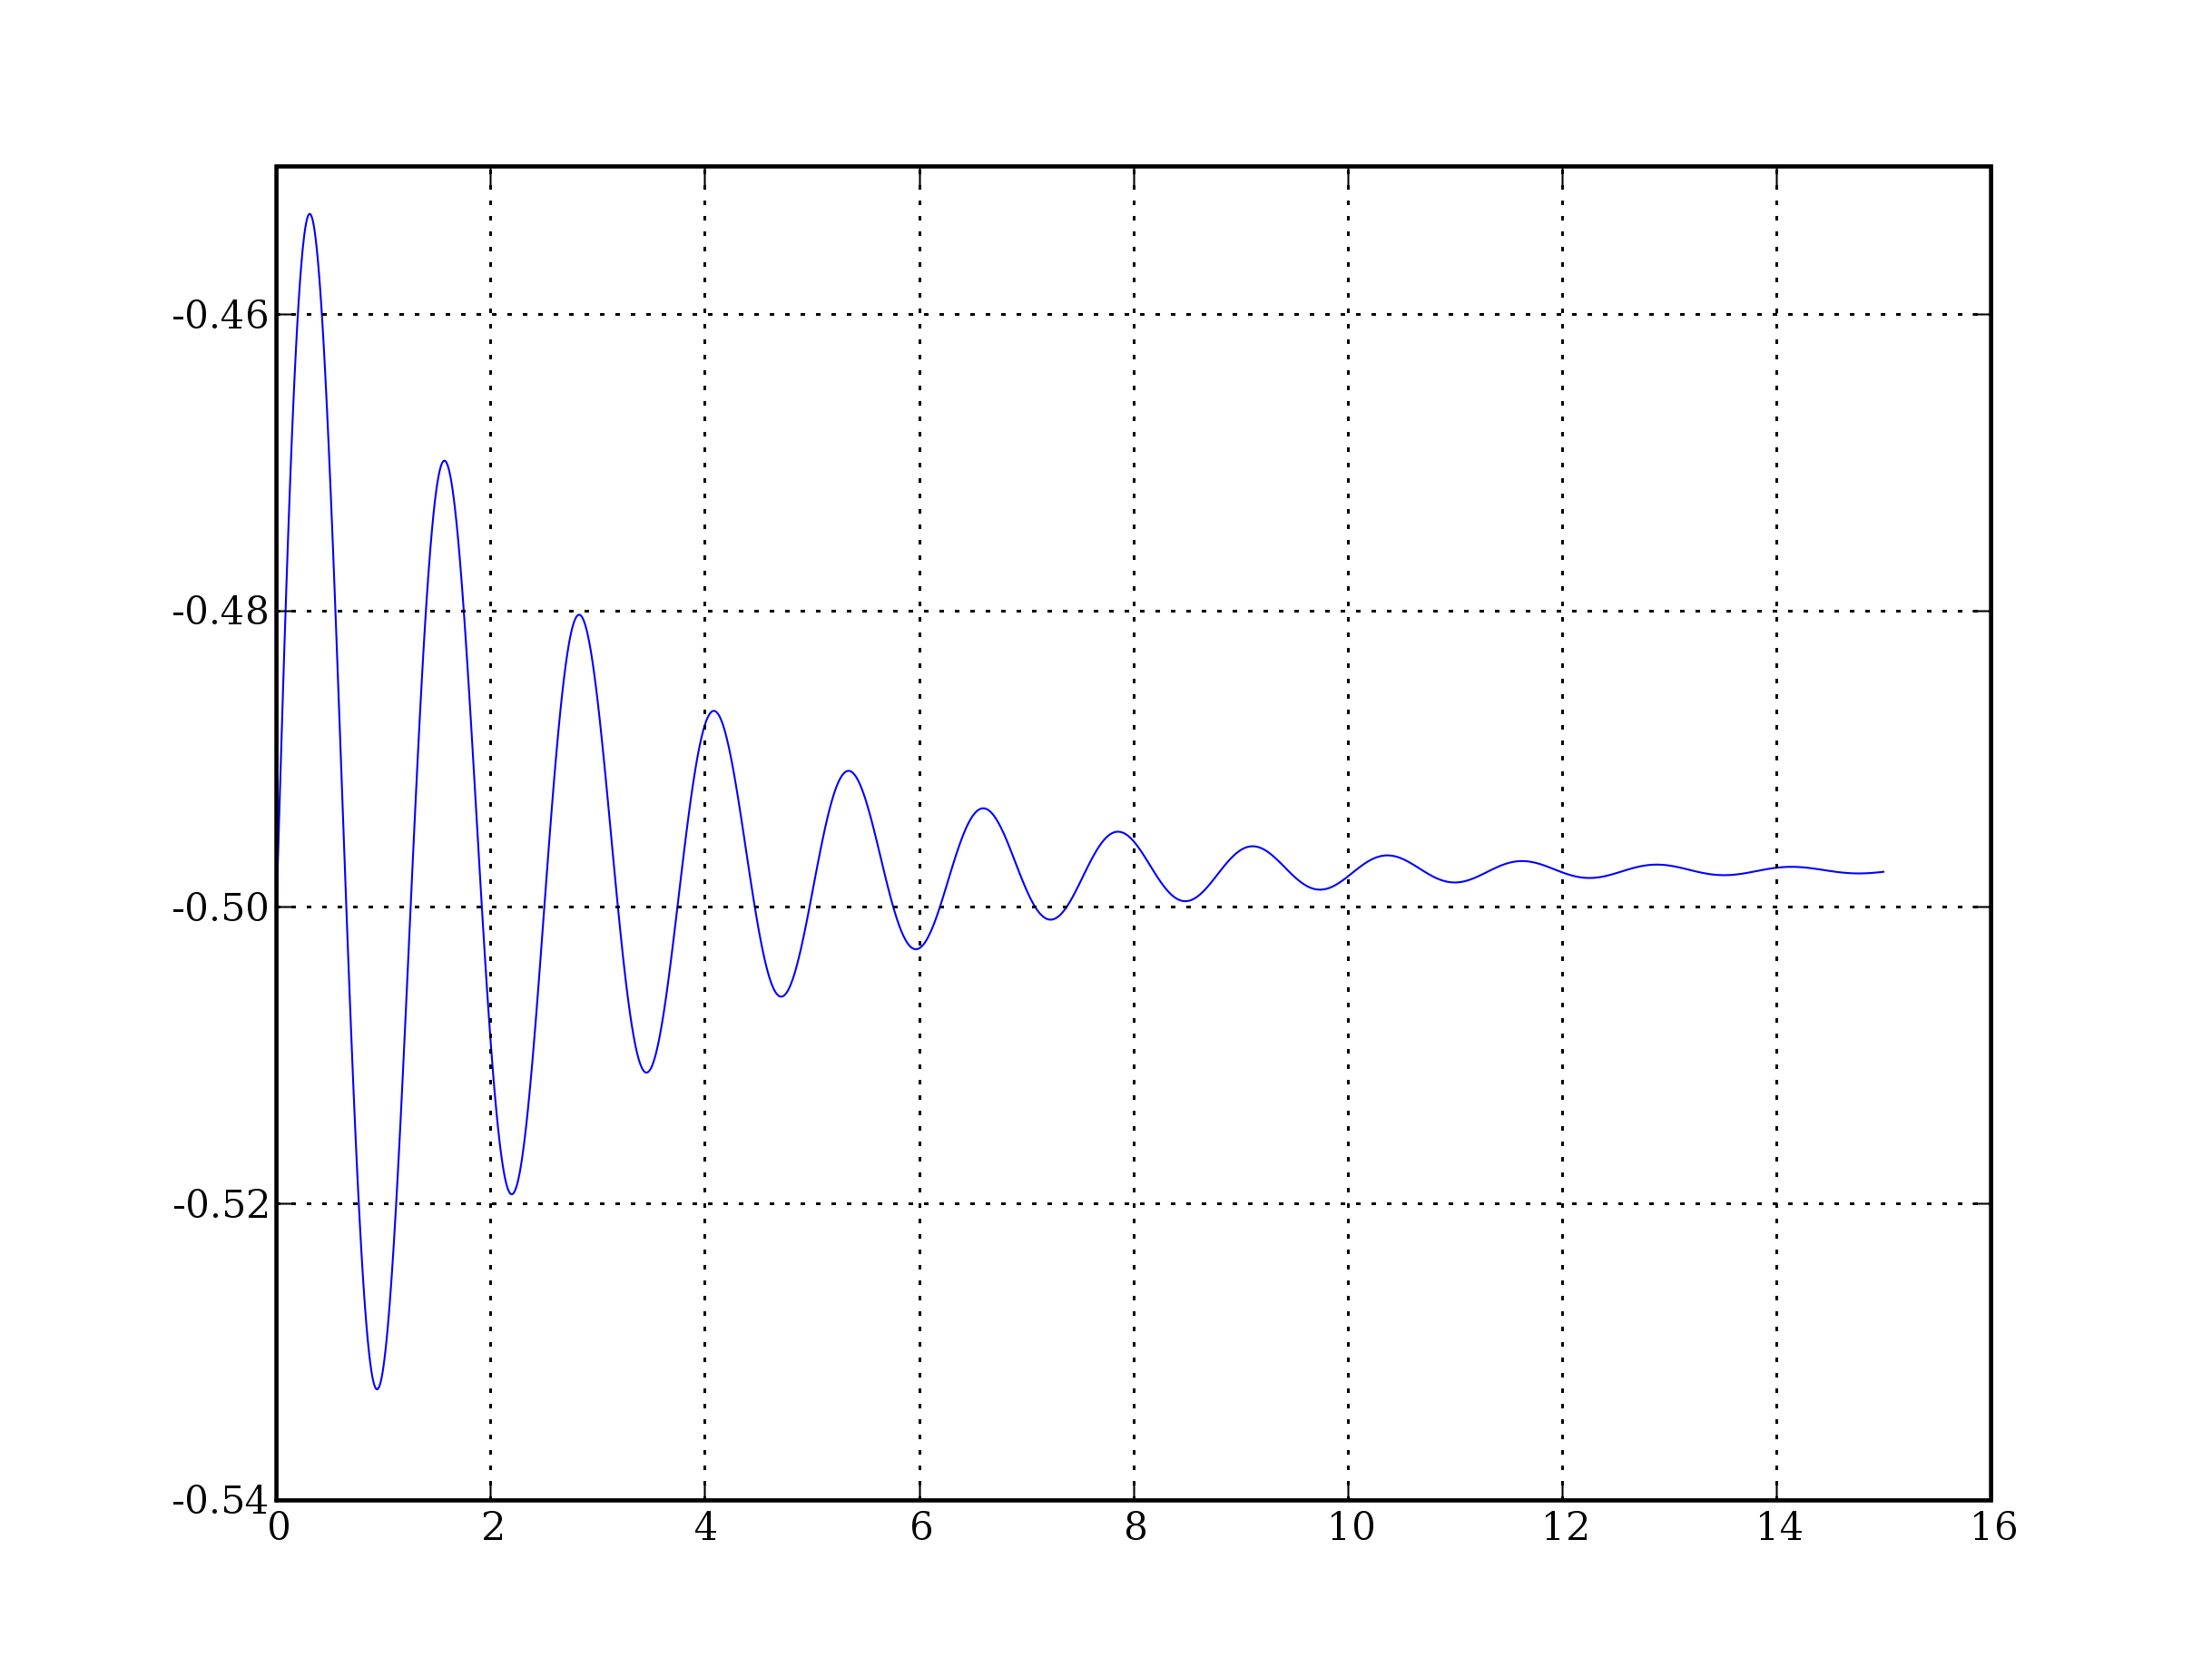
The case I’m interesting in, the soluction have the form of a sin*exp, so I
want to find the function that envolves it, a exponencial function.
To do this, I can find the maximas, and fit them, so I use:
def g4(t1):
sol2=odes.solucion((0.5
,0,0),t1,0.5,5,0)
return sol2[:,0]
x_max = optimize.fminbound(g4,0,2)
To use fminbound, I need a function that returns only a single array, so I use
de g4 function.
I use (0,2) as bounds.
The problem I have is that the return is:
x_max
1.9999959949686341
That aren’t the maximas in the interval.
If I change the interval:
x_max = optimize.fminbound(g4,0.1,4)
x_max
3.9999945129622403
And so on.
I don’t know what I’m doing wrong, so if everyone can help, I’m going to be really happy.
I wish if maybe there’s a better way to do it with matplotlib, but I don’t know.
