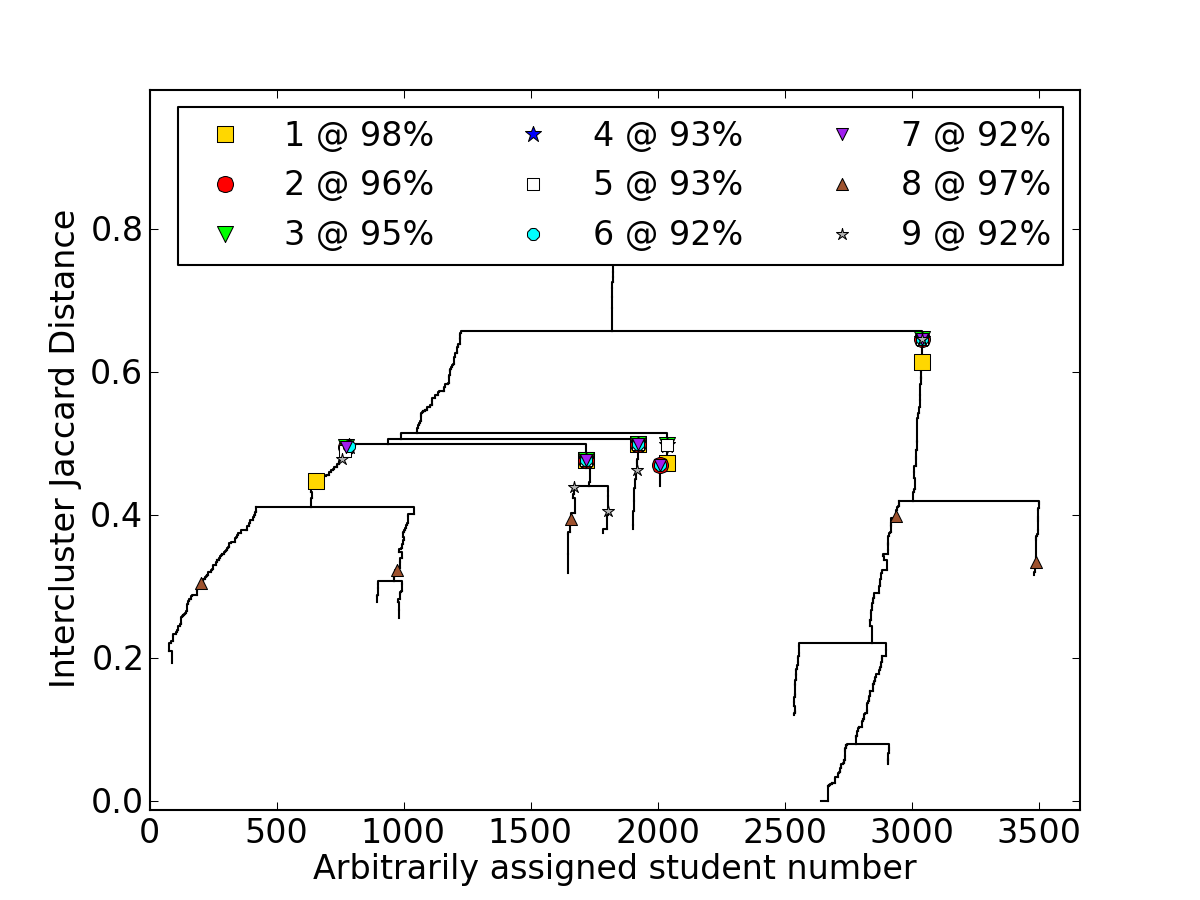
I've got a figure I'm working on in which certain points where some externally derived conditions are met are called out from a larger figure. Up to now, I've simply been overlaying a plot of those points on the graph, but several of the different series of points overlap with each other and I'm getting feedback that this makes the figure hard to read. Does anyone have any suggestions on how I might make it easier to distinguish each of the series of points? One suggestion that's been made to me locally was to use call-out boxes which pointed to sites where multiple series had points and in which the different point series could be laid out in a non-overlapping fashion, but I don't know how that might be done.
The attached figure (if it goes through) shows the state of the graph as I currently have it.
···
--
R. Padraic Springuel
Research Assistant
Department of Physics and Astronomy
University of Maine
Bennett 309
Office Hours: By Appointment Only