If possible, I think it is nice for matplotlib to be able to
> plot histograms by not only bars but also lines. My meaning of
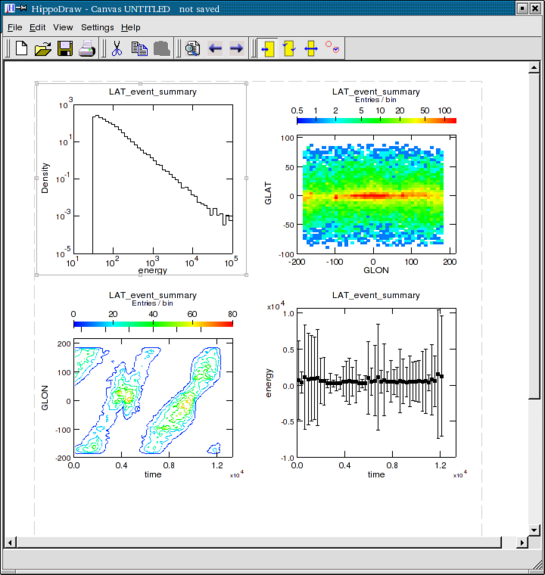
> "bar histogram plotting" is like the bottom-left plot in
> http://jas.freehep.org/images/screenshots/gui2.gif and "line
> histogram plotting" is like the others. There are two reasons.
If I understand you correctly, and from looking at the images you
linked to, all you need to do is set the edge and face properties of
the bars to the same color. The default edge color is black and the
default face color is blue, so if you want a solid histogram do
from matplotlib.matlab import *
mu, sigma = 100, 15
x = mu + sigma*randn(10000)
n, bins, patches = hist(x, 200, normed=1)
set(patches, 'edgecolor', 'b')
show()
Is this what you mean?
> Off course, the bar histogram plotting is more smart in one
> case, but in another case the line is better. In addition, the
> support of both bar and line histogram plotting will matplotlib
> to be able to have more plotting features that the colors of
> line and filled area can be specified separately by the user.
The axes function 'vlines' plots vertical lines. See the
example/vline_demo.py
Cheers,
John Hunter