Dear Matplotlib-Users.
I try to generate some 2d plot with dimension log10(p)-h from refprop.
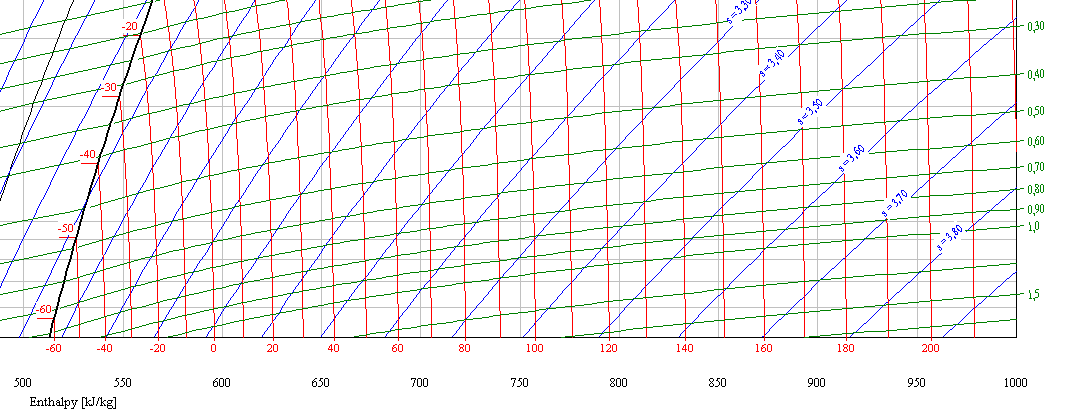
For the isolines (isentropes, isotherms, isochores etc.) I was successful but adding labels to these isolines were quite discouraging until now. Please have a view on the screenshot to have an idea of the feature I try to realize.
I tried to find a similar feature as given in the contour API for the clabel. There it is possible to define something like an inline label.
(Of course I could have done this job with contour plots from the beginnings. But please no hints like this. It would mean to begin from scratch again...)
Then I had the idea to generate points directly at the limits of the x- and y-axis on each isoline to use it for an annotate instance. But it would mean to annotate in the ticker region which is in a layer on top of the graph/image. Later I wanted to set markeredgewidth and markersize to zero just to have annotation as the feature of choice.
Now I am not sure how to procede and hope that someone of you has an idea.
Thanks in advance for your help.
Kindly regards,
Thore Oltersdorf
Thore,
I think I understand what you are asking, but I would like to make sure. If I understand you correctly, you are able to make all of your lines, but you want to annotate them within the graph? In addition, are you trying to label the lines so that the line is interrupted where there is text?
It would also be useful if you could attach an image of what you have managed to accomplish so far.
Ben Root
···
On Wed, Feb 9, 2011 at 5:18 AM, Thore Oltersdorf <thore.oltersdorf@…3436…> wrote:
Dear Matplotlib-Users.
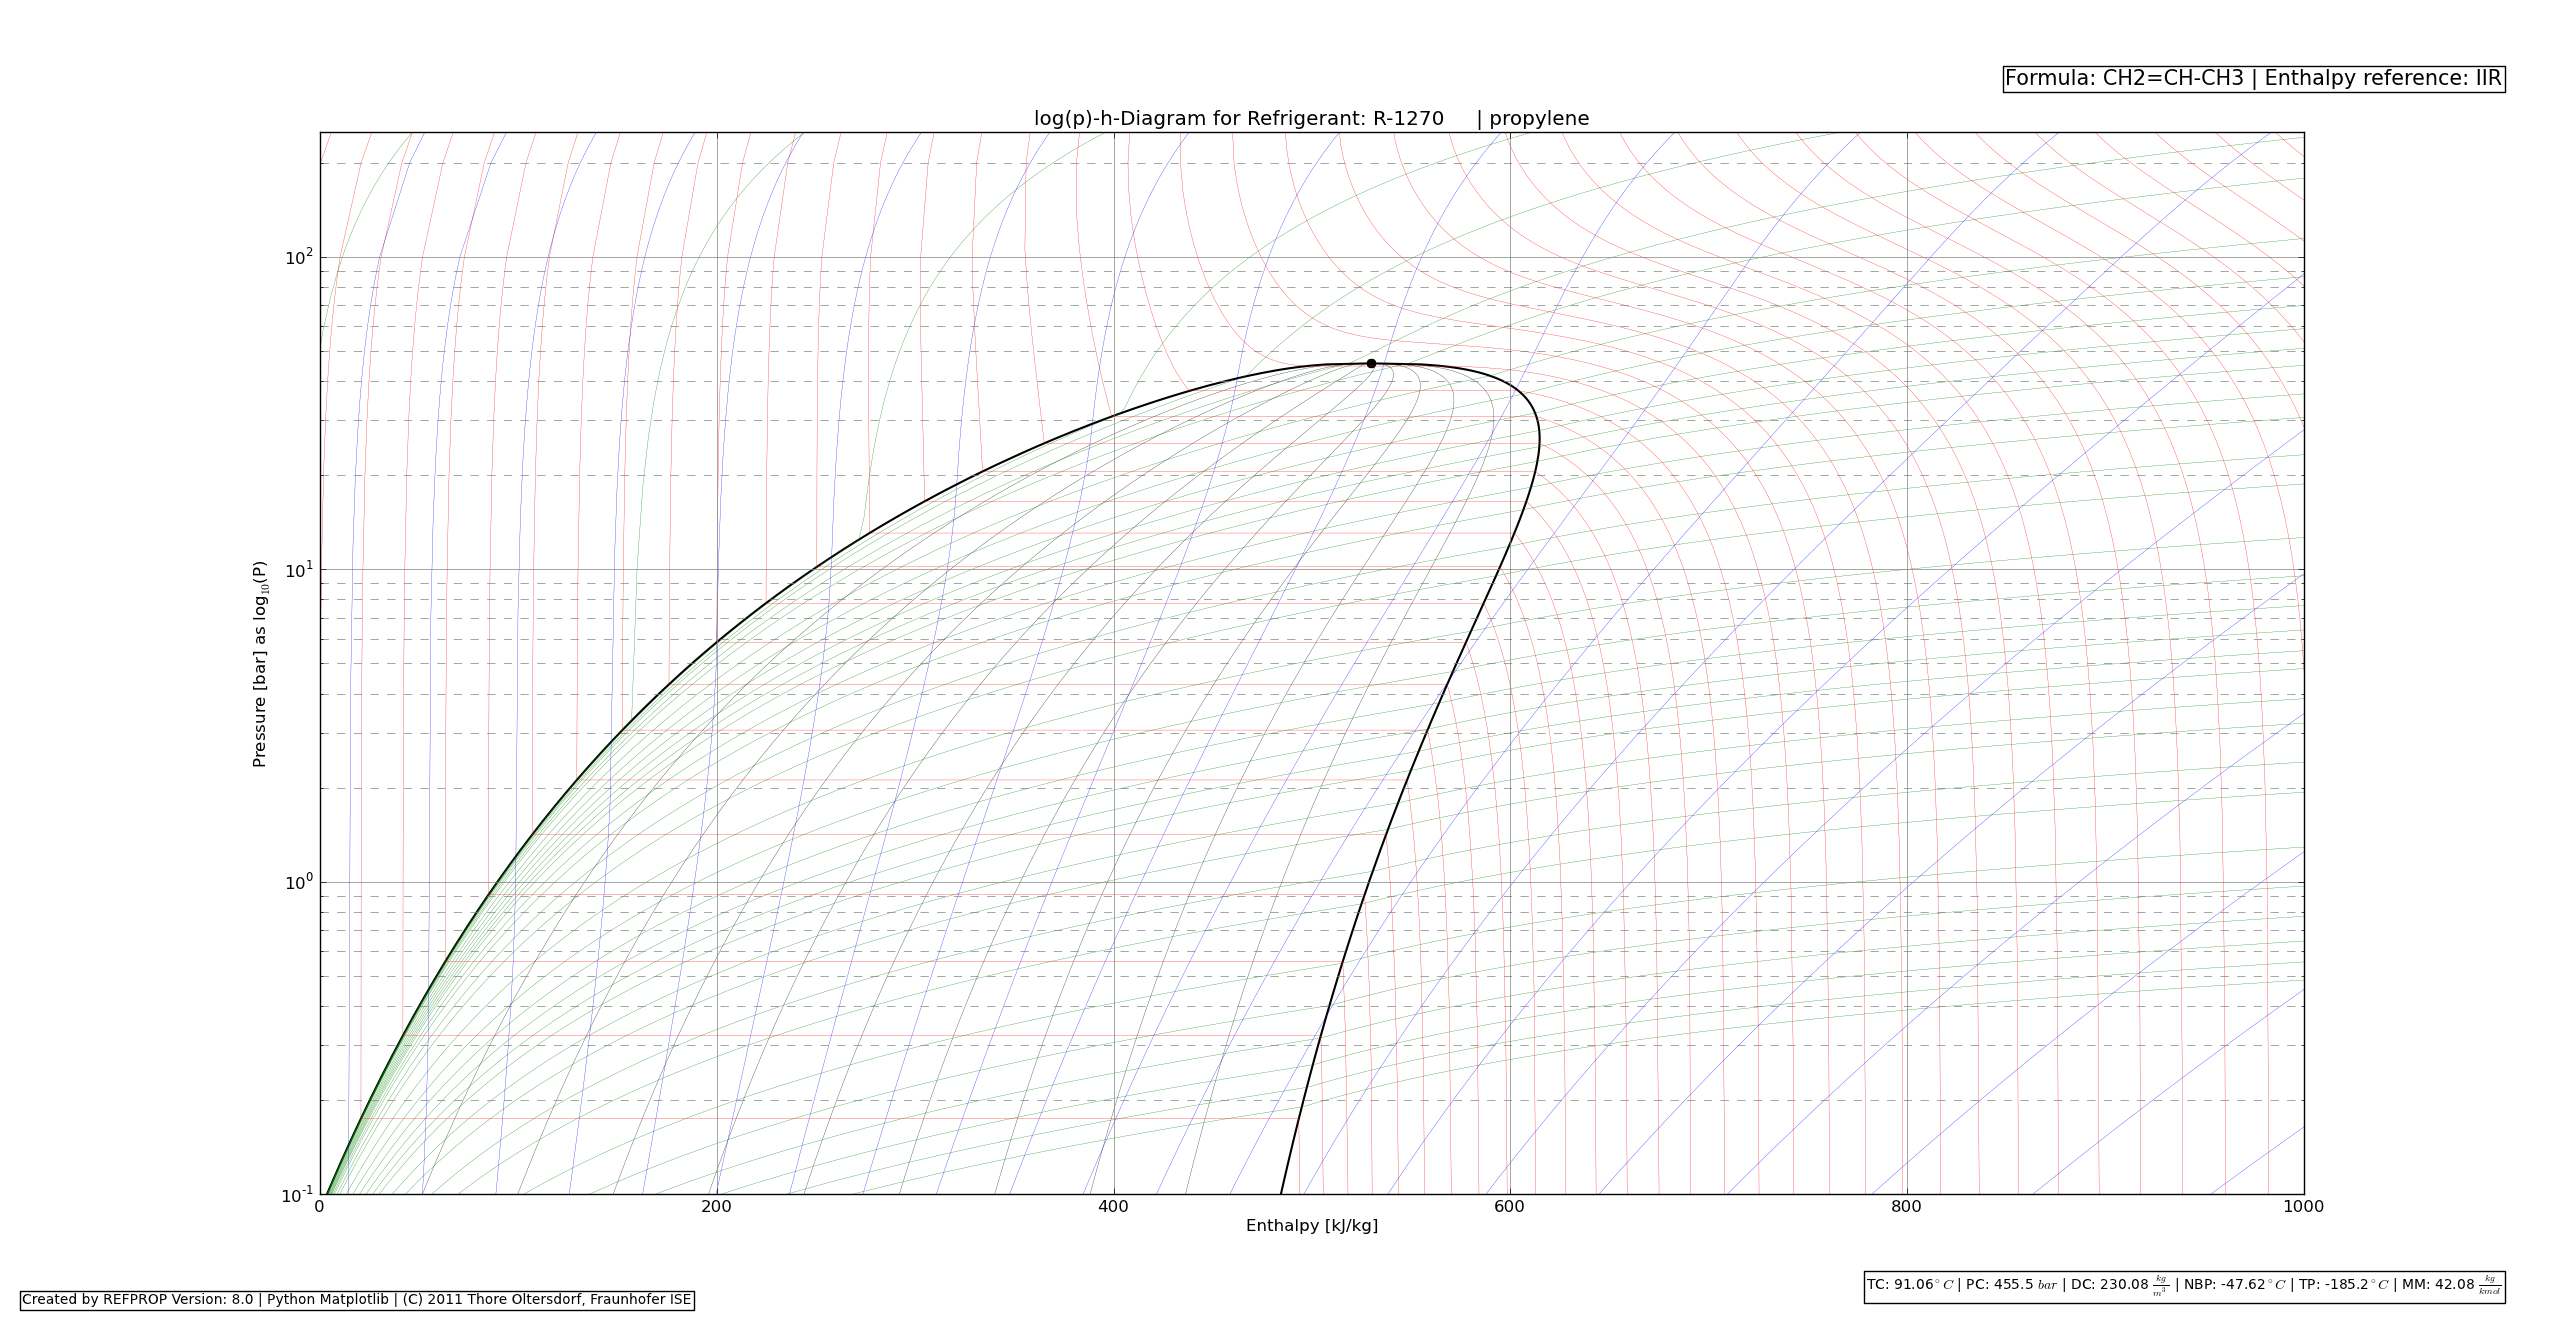
I try to generate some 2d plot with dimension log10(p)-h from refprop.
For the isolines (isentropes, isotherms, isochores etc.) I was successful but adding labels to these isolines were quite discouraging until now. Please have a view on the screenshot to have an idea of the feature I try to realize.
I tried to find a similar feature as given in the contour API for the clabel. There it is possible to define something like an inline label.
(Of course I could have done this job with contour plots from the beginnings. But please no hints like this. It would mean to begin from scratch again…)
Then I had the idea to generate points directly at the limits of the x- and y-axis on each isoline to use it for an annotate instance. But it would mean to annotate in the ticker region which is in a layer on top of the graph/image. Later I wanted to set markeredgewidth and markersize to zero just to have annotation as the feature of choice.
Now I am not sure how to procede and hope that someone of you has an idea.
Thanks in advance for your help.
Kindly regards,
Thore Oltersdorf
Hi Benjamin.
Thanks for your help. Next to the attached "target" you find attached now the actual state of the isolines I have so far. It's already pretty fast plotted since I use now scipy.io.loadmat for generating and storing the isolines separated from the usage of matplotlib.
The "inline" annotation as you describe it is the first idea I had when I saw the attached screenshot from my first post. But this could cover any data points. Thus I had the idea to put the "annotations" as much as possible to the "end" of the isolines / the image. But then for better readability it would be great to have it on both ends. Otherwise it's like a labyrinth by trying to follow the correct isoline.
But I would be satisfied by any(!) solution. It's possible to live with inline annotation by putting them to physically unrealistic regions of pressure/temperature.
Kindly regards,
Thore
Benjamin Root schrieb:
···
On Wed, Feb 9, 2011 at 5:18 AM, Thore Oltersdorf < > thore.oltersdorf@...3436...> wrote:
Dear Matplotlib-Users.
I try to generate some 2d plot with dimension log10(p)-h from refprop.
For the isolines (isentropes, isotherms, isochores etc.) I was successful
but adding labels to these isolines were quite discouraging until now.
Please have a view on the screenshot to have an idea of the feature I try to
realize.
I tried to find a similar feature as given in the contour API for the
clabel. There it is possible to define something like an inline label.
(Of course I could have done this job with contour plots from the
beginnings. But please no hints like this. It would mean to begin from
scratch again...)
Then I had the idea to generate points directly at the limits of the x- and
y-axis on each isoline to use it for an annotate instance. But it would mean
to annotate in the ticker region which is in a layer on top of the
graph/image. Later I wanted to set markeredgewidth and markersize to zero
just to have annotation as the feature of choice.
Now I am not sure how to procede and hope that someone of you has an idea.
Thanks in advance for your help.
Kindly regards,
Thore Oltersdorf
Thore,
I think I understand what you are asking, but I would like to make sure. If
I understand you correctly, you are able to make all of your lines, but you
want to annotate them within the graph? In addition, are you trying to
label the lines so that the line is interrupted where there is text?
It would also be useful if you could attach an image of what you have
managed to accomplish so far.
Ben Root
--
Dipl.-Ing. Thore Oltersdorf
Solar Building Group
Dept. Thermal Systems and Buildings
Fraunhofer-Institut f�r Solare Energiesysteme ISE
Heidenhofstrasse 2, 79110 Freiburg, Germany
Phone: +49 (0)761/4588-5239 Fax: +49 (0)761/4588-9239
thore.oltersdorf--<1!at!1>--ise.fraunhofer.de
http://HLK.ise.fraunhofer.de