Dear Jeff & ALL,
When trying to plot a set of points in Basemap using an
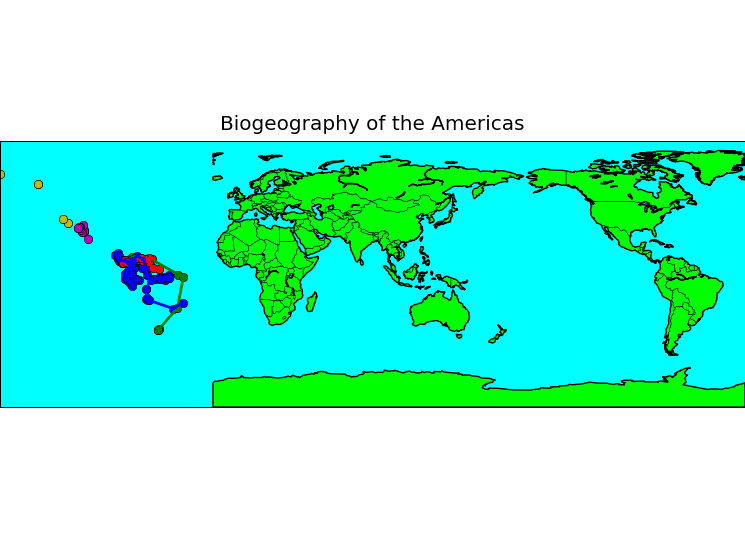
Equirectangular projection centered on a longitude different from the
default (using the parameter lon_0 to generate a map centered on the
desired longitude), I end up with a stange plot like the one attached
to this message (ie., all the points are plotted "over the edge of the
world"). Has Basemap been taught about the sphericity of the Earth?
(just a joke!)
N.B. This happens no matter if I call ax.cla() (where ax is an
instance of figure.axes) and reload all the dataset after changing the
longitude.
Any hints?
With warmest regards,
···
--
Dr. Mauro J. Cavalcanti
Ecoinformatics Studio
P.O. Box 46521, CEP 20551-970
Rio de Janeiro, RJ, BRASIL
E-mail: maurobio@...287...
Web: http://studio.infobio.net
Linux Registered User #473524 * Ubuntu User #22717
"Life is complex. It consists of real and imaginary parts."