I'm using Flask to output graphs to a web service, and when I move
from a standalone script to the web service I'm getting weird
behavior.
In gantt_test.py, I do this:
from matplotlib.backends.backend_agg import FigureCanvasAgg as FigureCanvas
from matplotlib.figure import Figure
[...]
canvas = FigureCanvas(fig)
fig.savefig("gantt.png")
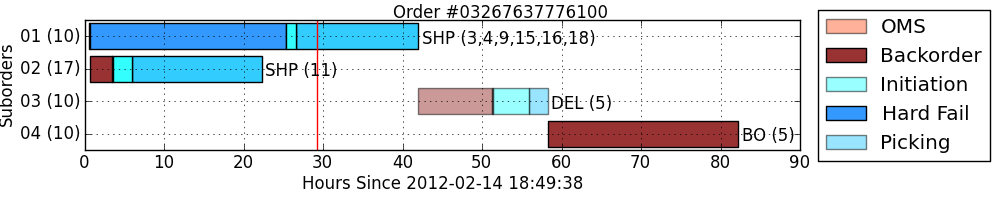
And it looks nice.
In the web service, the only difference is:
canvas = FigureCanvas(fig)
x = StringIO()
canvas.print_png(x, facecolor="w", edgecolor="w", dpi=100)
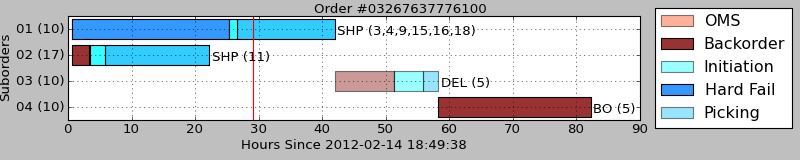
And it has a grey background, weirder margins, and seems to be stuck at dpi=80.
What am I missing? The version of python & matplotlib are the same
between machines. One is Windows 7, the other 2K3.
-Jeff
gantt_test.py (4.85 KB)
qd_web_service.py (5.72 KB)
I'm using Flask to output graphs to a web service, and when I move
from a standalone script to the web service I'm getting weird
behavior.
In gantt_test.py, I do this:
from matplotlib.backends.backend_agg import FigureCanvasAgg as FigureCanvas
from matplotlib.figure import Figure
[...]
canvas = FigureCanvas(fig)
fig.savefig("gantt.png")
And it looks nice.
In the web service, the only difference is:
canvas = FigureCanvas(fig)
x = StringIO()
canvas.print_png(x, facecolor="w", edgecolor="w", dpi=100)
What happens if instead of using canvas.print_png you use
fig.savefig(x, format="png")
Eric
···
On 02/20/2012 01:36 PM, Jeffrey Melloy wrote:
And it has a grey background, weirder margins, and seems to be stuck at dpi=80.
What am I missing? The version of python& matplotlib are the same
between machines. One is Windows 7, the other 2K3.
-Jeff
------------------------------------------------------------------------------
Try before you buy = See our experts in action!
The most comprehensive online learning library for Microsoft developers
is just $99.99! Visual Studio, SharePoint, SQL - plus HTML5, CSS3, MVC3,
Metro Style Apps, more. Free future releases when you subscribe now!
http://p.sf.net/sfu/learndevnow-dev2
_______________________________________________
Matplotlib-users mailing list
Matplotlib-users@lists.sourceforge.net
matplotlib-users List Signup and Options
It works perfectly. I thought I had tried that. 
···
On Mon, Feb 20, 2012 at 4:18 PM, Eric Firing <efiring@...202...> wrote:
On 02/20/2012 01:36 PM, Jeffrey Melloy wrote:
I'm using Flask to output graphs to a web service, and when I move
from a standalone script to the web service I'm getting weird
behavior.
In gantt_test.py, I do this:
from matplotlib.backends.backend_agg import FigureCanvasAgg as FigureCanvas
from matplotlib.figure import Figure
[...]
canvas = FigureCanvas(fig)
fig.savefig("gantt.png")
And it looks nice.
In the web service, the only difference is:
 canvas = FigureCanvas\(fig\)

 x = StringIO\(\)

 canvas\.print\_png\(x, facecolor="w", edgecolor="w", dpi=100\)
What happens if instead of using canvas.print_png you use
fig.savefig(x, format="png")
Eric
And it has a grey background, weirder margins, and seems to be stuck at dpi=80.
What am I missing? The version of python& matplotlib are the same
between machines. One is Windows 7, the other 2K3.
-Jeff
------------------------------------------------------------------------------
Try before you buy = See our experts in action!
The most comprehensive online learning library for Microsoft developers
is just $99.99! Visual Studio, SharePoint, SQL - plus HTML5, CSS3, MVC3,
Metro Style Apps, more. Free future releases when you subscribe now!
http://p.sf.net/sfu/learndevnow-dev2
_______________________________________________
Matplotlib-users mailing list
Matplotlib-users@lists.sourceforge.net
matplotlib-users List Signup and Options
------------------------------------------------------------------------------
Keep Your Developer Skills Current with LearnDevNow!
The most comprehensive online learning library for Microsoft developers
is just $99.99! Visual Studio, SharePoint, SQL - plus HTML5, CSS3, MVC3,
Metro Style Apps, more. Free future releases when you subscribe now!
http://p.sf.net/sfu/learndevnow-d2d
_______________________________________________
Matplotlib-users mailing list
Matplotlib-users@lists.sourceforge.net
matplotlib-users List Signup and Options