Hello,
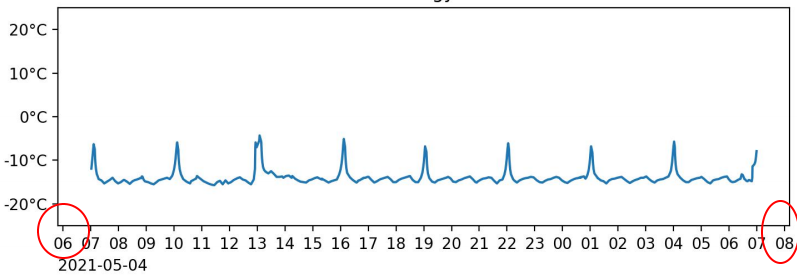
I am trying to generate daily graphs based on an API that is returning one data every hour (ie. temperature in the image). The returned data contains exactly one day data: the first point is at 07:00 in the morning and the last is again at 07:00 in the morning of the next day. (timezone is in Central Europe). But as it can bee seen in the image, at the left side there is an “extra” ticker at 06:00 and at the right side an “extra” ticker at 08:00. How can I get rid of these “extra” tickers?
Or as an alternative solution, how can I force the plot to start at 07:00 and end at the next 07:00?
Any help is appreciated!