(Sorry, I submitted this email with a real figure instead of a toy
example and the file size was too big and it awaits moderator
approval).
I am afraid I asked you to open a can of worms and now I don't know
what we should do. With my font size settings, \small looks to small
for the exponents. I tried \normalsize and actually got decent
results with \large (replacing all occurances of \small in your
ticker.py). See that attached file. But if \small looked good with
your settings, I am afraid things are now dependent on the font
settings in the rc file as far as what should go in the latex command
for the exponents.
I remember that this problem came up because I complained about serif
fonts in my exponents and we were having a hard time making tex use
sans serif math fonts.
Maybe the best solution is for me to go back in time and retract that complaint.
I don't know. Sorry about the mess this had made. I have plots I am
fairly happy with (I will poke around in my rc file and see if I can
find out why my x and y axis fonts look different).
Ryan
···
On 6/14/06, Ryan Krauss <ryanlists@...287...> wrote:
I am afraid I asked you to open a can of worms and now I don't know
what we should do. With my font size settings, \small looks to small
for the exponents. I tried \normalsize and actually got decent
results with \large (replacing all occurances of \small in your
ticker.py). See that attached file. But if \small looked good with
your settings, I am afraid things are now dependent on the font
settings in the rc file as far as what should go in the latex command
for the exponents.
I remember that this problem came up because I complained about serif
fonts in my exponents and we were having a hard time making tex use
sans serif math fonts.
Maybe the best solution is for me to go back in time and retract that complaint.
I don't know. Sorry about the mess this had made. I have plots I am
fairly happy with (I will poke around in my rc file and see if I can
find out why my x and y axis fonts look different).
Ryan
On 6/14/06, Ryan Krauss <ryanlists@...287...> wrote:
> I feel bad that I caused this problem and am now asking you to fix it.
>
> Ryan
>
> On 6/14/06, Darren Dale <dd55@...163...> wrote:
> > This is an artifact that was introduced when I tried to give you support for
> > sans-serif fonts in the exponent. Try the attached ticker.py, it wraps the
> > exponent in {\small}. Let me know if this is acceptable, and I'll commit it.
> >
> > On Wednesday 14 June 2006 19:14, Ryan Krauss wrote:
> > > I still have the problem with large exponents with your matplotlibrc
> > > file (but the y-axis plots are no longer different).
> > >
> > > Any thoughts on what I should try next?
> > >
> > > Ryan
> > >
> > > On 6/14/06, Darren Dale <dd55@...163...> wrote:
> > > > On Wednesday 14 June 2006 18:51, you wrote:
> > > > > There was a lot of stuff in my tex.cache, but deleting didn't solve my
> > > > > problem.
> > > > >
> > > > > I may have some strange choices for my fonts and font sizes. Can you
> > > > > send me a copy of your matplotlibrc file.
> > > > >
> > > > > Ryan
> > > > >
> > > > > On 6/14/06, Darren Dale <dd55@...163...> wrote:
> > > > > > Hi Ryan,
> > > > > >
> > > > > > I'm using the latest svn as well (2479), and I cant reproduce your
> > > > > > problem. Try deleting your tex.cache.
> > > > > >
> > > > > > Darren
> > > > > >
> > > > > > On Wednesday 14 June 2006 18:14, Ryan Krauss wrote:
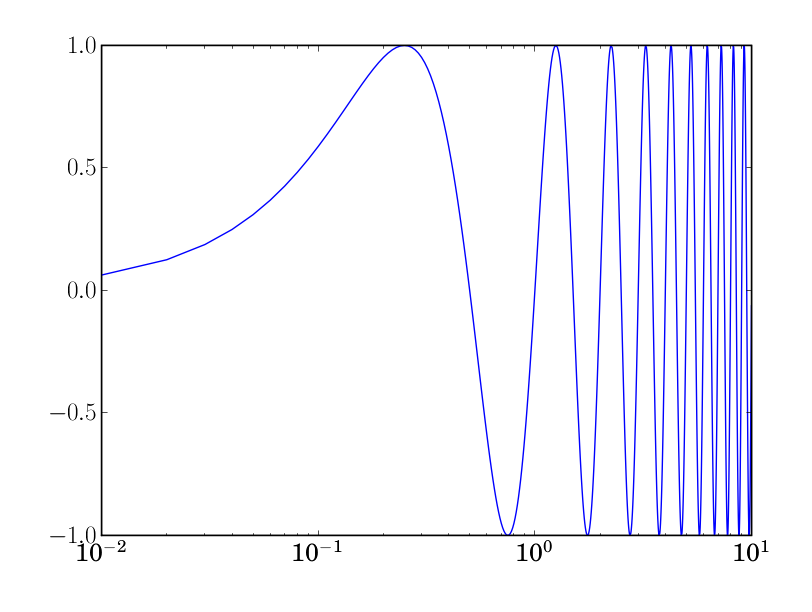
> > > > > > > I am having a problem with the fonts for exponents on semilog plots
> > > > > > > with usetex.
> > > > > > >
> > > > > > > The attached figure can be generated on my machine with
> > > > > > > figure(1)
> > > > > > > t=arange(0,10,0.01)
> > > > > > > y=sin(2*pi*t)
> > > > > > > semilogx(t,y)
> > > > > > >
> > > > > > > I just upgraded to the latest svn and now the y-axis plots look
> > > > > > > different from the x-axis.
> > > > > > > matplotlib.__version__
> > > > > > > Out[6]: '0.87.3'
> > > > > > >
> > > > > > > Ryan
> > > > > >
> > > > > > --
> > > > > > Darren S. Dale, Ph.D.
> > > > > > Cornell High Energy Synchrotron Source
> > > > > > Cornell University
> > > > > > 200L Wilson Lab
> > > > > > Rt. 366 & Pine Tree Road
> > > > > > Ithaca, NY 14853
> > > > > >
> > > > > > dd55@...163...
> > > > > > office: (607) 255-9894
> > > > > > fax: (607) 255-9001
> > > > > >
> > > > > > _______________________________________________
> > > > > > Matplotlib-users mailing list
> > > > > > Matplotlib-users@lists.sourceforge.net
> > > > > > matplotlib-users List Signup and Options
> > > > >
> > > > > _______________________________________________
> > > > > Matplotlib-users mailing list
> > > > > Matplotlib-users@lists.sourceforge.net
> > > > > matplotlib-users List Signup and Options
> > > >
> > > > --
> > > > Darren S. Dale, Ph.D.
> > > > Cornell High Energy Synchrotron Source
> > > > Cornell University
> > > > 200L Wilson Lab
> > > > Rt. 366 & Pine Tree Road
> > > > Ithaca, NY 14853
> > > >
> > > > dd55@...163...
> > > > office: (607) 255-9894
> > > > fax: (607) 255-9001
> >
> > --
> > Darren S. Dale, Ph.D.
> > Cornell High Energy Synchrotron Source
> > Cornell University
> > 200L Wilson Lab
> > Rt. 366 & Pine Tree Road
> > Ithaca, NY 14853
> >
> > dd55@...163...
> > office: (607) 255-9894
> > fax: (607) 255-9001
> >
> > _______________________________________________
> > Matplotlib-users mailing list
> > Matplotlib-users@lists.sourceforge.net
> > matplotlib-users List Signup and Options
> >
>
I agree that this little experiment of trying to work around latex's
limitations has been too much trouble. I suggest we go back to the old
behavior, and anyone who wants sans-serif fonts in their exponents can use
regular mathtext. I'm hopeful that Edin can make some strides with mpl's
mathtext support, and in the meantime, people should get decent results if
they set ps.useafm : True in their rc settings.
Comments?
···
On Wednesday 14 June 2006 19:53, Ryan Krauss wrote:
(Sorry, I submitted this email with a real figure instead of a toy
example and the file size was too big and it awaits moderator
approval).
I am afraid I asked you to open a can of worms and now I don't know
what we should do. With my font size settings, \small looks to small
for the exponents. I tried \normalsize and actually got decent
results with \large (replacing all occurances of \small in your
ticker.py). See that attached file. But if \small looked good with
your settings, I am afraid things are now dependent on the font
settings in the rc file as far as what should go in the latex command
for the exponents.
I remember that this problem came up because I complained about serif
fonts in my exponents and we were having a hard time making tex use
sans serif math fonts.
Maybe the best solution is for me to go back in time and retract that
complaint.
I don't know. Sorry about the mess this had made. I have plots I am
fairly happy with (I will poke around in my rc file and see if I can
find out why my x and y axis fonts look different).
Ryan
On 6/14/06, Ryan Krauss <ryanlists@...287...> wrote:
> I am afraid I asked you to open a can of worms and now I don't know
> what we should do. With my font size settings, \small looks to small
> for the exponents. I tried \normalsize and actually got decent
> results with \large (replacing all occurances of \small in your
> ticker.py). See that attached file. But if \small looked good with
> your settings, I am afraid things are now dependent on the font
> settings in the rc file as far as what should go in the latex command
> for the exponents.
>
> I remember that this problem came up because I complained about serif
> fonts in my exponents and we were having a hard time making tex use
> sans serif math fonts.
>
> Maybe the best solution is for me to go back in time and retract that
> complaint.
>
> I don't know. Sorry about the mess this had made. I have plots I am
> fairly happy with (I will poke around in my rc file and see if I can
> find out why my x and y axis fonts look different).
>
> Ryan
>
> On 6/14/06, Ryan Krauss <ryanlists@...287...> wrote:
> > I feel bad that I caused this problem and am now asking you to fix it.
> >
> > Ryan
> >
> > On 6/14/06, Darren Dale <dd55@...163...> wrote:
> > > This is an artifact that was introduced when I tried to give you
> > > support for sans-serif fonts in the exponent. Try the attached
> > > ticker.py, it wraps the exponent in {\small}. Let me know if this is
> > > acceptable, and I'll commit it.
> > >
> > > On Wednesday 14 June 2006 19:14, Ryan Krauss wrote:
> > > > I still have the problem with large exponents with your
> > > > matplotlibrc file (but the y-axis plots are no longer different).
> > > >
> > > > Any thoughts on what I should try next?
> > > >
> > > > Ryan
> > > >
> > > > On 6/14/06, Darren Dale <dd55@...163...> wrote:
> > > > > On Wednesday 14 June 2006 18:51, you wrote:
> > > > > > There was a lot of stuff in my tex.cache, but deleting didn't
> > > > > > solve my problem.
> > > > > >
> > > > > > I may have some strange choices for my fonts and font sizes.
> > > > > > Can you send me a copy of your matplotlibrc file.
> > > > > >
> > > > > > Ryan
> > > > > >
> > > > > > On 6/14/06, Darren Dale <dd55@...163...> wrote:
> > > > > > > Hi Ryan,
> > > > > > >
> > > > > > > I'm using the latest svn as well (2479), and I cant reproduce
> > > > > > > your problem. Try deleting your tex.cache.
> > > > > > >
> > > > > > > Darren
> > > > > > >
> > > > > > > On Wednesday 14 June 2006 18:14, Ryan Krauss wrote:
> > > > > > > > I am having a problem with the fonts for exponents on
> > > > > > > > semilog plots with usetex.
> > > > > > > >
> > > > > > > > The attached figure can be generated on my machine with
> > > > > > > > figure(1)
> > > > > > > > t=arange(0,10,0.01)
> > > > > > > > y=sin(2*pi*t)
> > > > > > > > semilogx(t,y)
> > > > > > > >
> > > > > > > > I just upgraded to the latest svn and now the y-axis plots
> > > > > > > > look different from the x-axis.
> > > > > > > > matplotlib.__version__
> > > > > > > > Out[6]: '0.87.3'
> > > > > > > >
> > > > > > > >
> > > > > > > > Ryan
> > > > > > >
> > > > > > > --
> > > > > > > Darren S. Dale, Ph.D.
> > > > > > > Cornell High Energy Synchrotron Source
> > > > > > > Cornell University
> > > > > > > 200L Wilson Lab
> > > > > > > Rt. 366 & Pine Tree Road
> > > > > > > Ithaca, NY 14853
> > > > > > >
> > > > > > > dd55@...163...
> > > > > > > office: (607) 255-9894
> > > > > > > fax: (607) 255-9001
> > > > > > >
> > > > > > >
> > > > > > > _______________________________________________
> > > > > > > Matplotlib-users mailing list
> > > > > > > Matplotlib-users@lists.sourceforge.net
> > > > > > > matplotlib-users List Signup and Options
> > > > > >
> > > > > > _______________________________________________
> > > > > > Matplotlib-users mailing list
> > > > > > Matplotlib-users@lists.sourceforge.net
> > > > > > matplotlib-users List Signup and Options
> > > > >
> > > > > --
> > > > > Darren S. Dale, Ph.D.
> > > > > Cornell High Energy Synchrotron Source
> > > > > Cornell University
> > > > > 200L Wilson Lab
> > > > > Rt. 366 & Pine Tree Road
> > > > > Ithaca, NY 14853
> > > > >
> > > > > dd55@...163...
> > > > > office: (607) 255-9894
> > > > > fax: (607) 255-9001
> > >
> > > --
> > > Darren S. Dale, Ph.D.
> > > Cornell High Energy Synchrotron Source
> > > Cornell University
> > > 200L Wilson Lab
> > > Rt. 366 & Pine Tree Road
> > > Ithaca, NY 14853
> > >
> > > dd55@...163...
> > > office: (607) 255-9894
> > > fax: (607) 255-9001
> > >
> > >
> > >
> > >
> > > _______________________________________________
> > > Matplotlib-users mailing list
> > > Matplotlib-users@lists.sourceforge.net
> > > matplotlib-users List Signup and Options
--
Darren S. Dale, Ph.D.
Cornell High Energy Synchrotron Source
Cornell University
200L Wilson Lab
Rt. 366 & Pine Tree Road
Ithaca, NY 14853
dd55@...163...
office: (607) 255-9894
fax: (607) 255-9001
It seems like no one has any comments on our plans concerning the
exponent fonts. Can you outline for me what it would take to fix
this? If it is fairly simple I may take a crack at it.
Ryan
···
On 6/14/06, Darren Dale <dd55@...163...> wrote:
I agree that this little experiment of trying to work around latex's
limitations has been too much trouble. I suggest we go back to the old
behavior, and anyone who wants sans-serif fonts in their exponents can use
regular mathtext. I'm hopeful that Edin can make some strides with mpl's
mathtext support, and in the meantime, people should get decent results if
they set ps.useafm : True in their rc settings.
Comments?
On Wednesday 14 June 2006 19:53, Ryan Krauss wrote:
> (Sorry, I submitted this email with a real figure instead of a toy
> example and the file size was too big and it awaits moderator
> approval).
>
> I am afraid I asked you to open a can of worms and now I don't know
> what we should do. With my font size settings, \small looks to small
> for the exponents. I tried \normalsize and actually got decent
> results with \large (replacing all occurances of \small in your
> ticker.py). See that attached file. But if \small looked good with
> your settings, I am afraid things are now dependent on the font
> settings in the rc file as far as what should go in the latex command
> for the exponents.
>
> I remember that this problem came up because I complained about serif
> fonts in my exponents and we were having a hard time making tex use
> sans serif math fonts.
>
> Maybe the best solution is for me to go back in time and retract that
> complaint.
>
> I don't know. Sorry about the mess this had made. I have plots I am
> fairly happy with (I will poke around in my rc file and see if I can
> find out why my x and y axis fonts look different).
>
> Ryan
>
> On 6/14/06, Ryan Krauss <ryanlists@...287...> wrote:
> > I am afraid I asked you to open a can of worms and now I don't know
> > what we should do. With my font size settings, \small looks to small
> > for the exponents. I tried \normalsize and actually got decent
> > results with \large (replacing all occurances of \small in your
> > ticker.py). See that attached file. But if \small looked good with
> > your settings, I am afraid things are now dependent on the font
> > settings in the rc file as far as what should go in the latex command
> > for the exponents.
> >
> > I remember that this problem came up because I complained about serif
> > fonts in my exponents and we were having a hard time making tex use
> > sans serif math fonts.
> >
> > Maybe the best solution is for me to go back in time and retract that
> > complaint.
> >
> > I don't know. Sorry about the mess this had made. I have plots I am
> > fairly happy with (I will poke around in my rc file and see if I can
> > find out why my x and y axis fonts look different).
> >
> > Ryan
> >
> > On 6/14/06, Ryan Krauss <ryanlists@...287...> wrote:
> > > I feel bad that I caused this problem and am now asking you to fix it.
> > >
> > > Ryan
> > >
> > > On 6/14/06, Darren Dale <dd55@...163...> wrote:
> > > > This is an artifact that was introduced when I tried to give you
> > > > support for sans-serif fonts in the exponent. Try the attached
> > > > ticker.py, it wraps the exponent in {\small}. Let me know if this is
> > > > acceptable, and I'll commit it.
> > > >
> > > > On Wednesday 14 June 2006 19:14, Ryan Krauss wrote:
> > > > > I still have the problem with large exponents with your
> > > > > matplotlibrc file (but the y-axis plots are no longer different).
> > > > >
> > > > > Any thoughts on what I should try next?
> > > > >
> > > > > Ryan
> > > > >
> > > > > On 6/14/06, Darren Dale <dd55@...163...> wrote:
> > > > > > On Wednesday 14 June 2006 18:51, you wrote:
> > > > > > > There was a lot of stuff in my tex.cache, but deleting didn't
> > > > > > > solve my problem.
> > > > > > >
> > > > > > > I may have some strange choices for my fonts and font sizes.
> > > > > > > Can you send me a copy of your matplotlibrc file.
> > > > > > >
> > > > > > > Ryan
> > > > > > >
> > > > > > > On 6/14/06, Darren Dale <dd55@...163...> wrote:
> > > > > > > > Hi Ryan,
> > > > > > > >
> > > > > > > > I'm using the latest svn as well (2479), and I cant reproduce
> > > > > > > > your problem. Try deleting your tex.cache.
> > > > > > > >
> > > > > > > > Darren
> > > > > > > >
> > > > > > > > On Wednesday 14 June 2006 18:14, Ryan Krauss wrote:
> > > > > > > > > I am having a problem with the fonts for exponents on
> > > > > > > > > semilog plots with usetex.
> > > > > > > > >
> > > > > > > > > The attached figure can be generated on my machine with
> > > > > > > > > figure(1)
> > > > > > > > > t=arange(0,10,0.01)
> > > > > > > > > y=sin(2*pi*t)
> > > > > > > > > semilogx(t,y)
> > > > > > > > >
> > > > > > > > > I just upgraded to the latest svn and now the y-axis plots
> > > > > > > > > look different from the x-axis.
> > > > > > > > > matplotlib.__version__
> > > > > > > > > Out[6]: '0.87.3'
> > > > > > > > >
> > > > > > > > > Ryan
> > > > > > > >
> > > > > > > > --
> > > > > > > > Darren S. Dale, Ph.D.
> > > > > > > > Cornell High Energy Synchrotron Source
> > > > > > > > Cornell University
> > > > > > > > 200L Wilson Lab
> > > > > > > > Rt. 366 & Pine Tree Road
> > > > > > > > Ithaca, NY 14853
> > > > > > > >
> > > > > > > > dd55@...163...
> > > > > > > > office: (607) 255-9894
> > > > > > > > fax: (607) 255-9001
> > > > > > > >
> > > > > > > > _______________________________________________
> > > > > > > > Matplotlib-users mailing list
> > > > > > > > Matplotlib-users@lists.sourceforge.net
> > > > > > > > matplotlib-users List Signup and Options
> > > > > > >
> > > > > > > _______________________________________________
> > > > > > > Matplotlib-users mailing list
> > > > > > > Matplotlib-users@lists.sourceforge.net
> > > > > > > matplotlib-users List Signup and Options
> > > > > >
> > > > > > --
> > > > > > Darren S. Dale, Ph.D.
> > > > > > Cornell High Energy Synchrotron Source
> > > > > > Cornell University
> > > > > > 200L Wilson Lab
> > > > > > Rt. 366 & Pine Tree Road
> > > > > > Ithaca, NY 14853
> > > > > >
> > > > > > dd55@...163...
> > > > > > office: (607) 255-9894
> > > > > > fax: (607) 255-9001
> > > >
> > > > --
> > > > Darren S. Dale, Ph.D.
> > > > Cornell High Energy Synchrotron Source
> > > > Cornell University
> > > > 200L Wilson Lab
> > > > Rt. 366 & Pine Tree Road
> > > > Ithaca, NY 14853
> > > >
> > > > dd55@...163...
> > > > office: (607) 255-9894
> > > > fax: (607) 255-9001
> > > >
> > > > _______________________________________________
> > > > Matplotlib-users mailing list
> > > > Matplotlib-users@lists.sourceforge.net
> > > > matplotlib-users List Signup and Options
--
Darren S. Dale, Ph.D.
Cornell High Energy Synchrotron Source
Cornell University
200L Wilson Lab
Rt. 366 & Pine Tree Road
Ithaca, NY 14853
dd55@...163...
office: (607) 255-9894
fax: (607) 255-9001
_______________________________________________
Matplotlib-users mailing list
Matplotlib-users@lists.sourceforge.net
matplotlib-users List Signup and Options
We didnt get any comments against, so I committed the changes this morning. We
will no longer try to support sans-serif mathmode fonts with the usetex
option, since there is no native support for them in latex. If you are using
svn matplotlib, I suggest clearing your tex.cache after updating.
Darren
···
On Wednesday 14 June 2006 8:19 pm, Darren Dale wrote:
I agree that this little experiment of trying to work around latex's
limitations has been too much trouble. I suggest we go back to the old
behavior, and anyone who wants sans-serif fonts in their exponents can use
regular mathtext. I'm hopeful that Edin can make some strides with mpl's
mathtext support, and in the meantime, people should get decent results if
they set ps.useafm : True in their rc settings.
Comments?
On Wednesday 14 June 2006 19:53, Ryan Krauss wrote:
> (Sorry, I submitted this email with a real figure instead of a toy
> example and the file size was too big and it awaits moderator
> approval).
>
> I am afraid I asked you to open a can of worms and now I don't know
> what we should do. With my font size settings, \small looks to small
> for the exponents. I tried \normalsize and actually got decent
> results with \large (replacing all occurances of \small in your
> ticker.py). See that attached file. But if \small looked good with
> your settings, I am afraid things are now dependent on the font
> settings in the rc file as far as what should go in the latex command
> for the exponents.
>
> I remember that this problem came up because I complained about serif
> fonts in my exponents and we were having a hard time making tex use
> sans serif math fonts.
>
> Maybe the best solution is for me to go back in time and retract that
> complaint.
>
> I don't know. Sorry about the mess this had made. I have plots I am
> fairly happy with (I will poke around in my rc file and see if I can
> find out why my x and y axis fonts look different).
>
> Ryan
>
> On 6/14/06, Ryan Krauss <ryanlists@...287...> wrote:
> > I am afraid I asked you to open a can of worms and now I don't know
> > what we should do. With my font size settings, \small looks to small
> > for the exponents. I tried \normalsize and actually got decent
> > results with \large (replacing all occurances of \small in your
> > ticker.py). See that attached file. But if \small looked good with
> > your settings, I am afraid things are now dependent on the font
> > settings in the rc file as far as what should go in the latex command
> > for the exponents.
> >
> > I remember that this problem came up because I complained about serif
> > fonts in my exponents and we were having a hard time making tex use
> > sans serif math fonts.
> >
> > Maybe the best solution is for me to go back in time and retract that
> > complaint.
> >
> > I don't know. Sorry about the mess this had made. I have plots I am
> > fairly happy with (I will poke around in my rc file and see if I can
> > find out why my x and y axis fonts look different).
> >
> > Ryan
> >
> > On 6/14/06, Ryan Krauss <ryanlists@...287...> wrote:
> > > I feel bad that I caused this problem and am now asking you to fix
> > > it.
> > >
> > > Ryan
> > >
> > > On 6/14/06, Darren Dale <dd55@...163...> wrote:
> > > > This is an artifact that was introduced when I tried to give you
> > > > support for sans-serif fonts in the exponent. Try the attached
> > > > ticker.py, it wraps the exponent in {\small}. Let me know if this
> > > > is acceptable, and I'll commit it.
> > > >
> > > > On Wednesday 14 June 2006 19:14, Ryan Krauss wrote:
> > > > > I still have the problem with large exponents with your
> > > > > matplotlibrc file (but the y-axis plots are no longer different).
> > > > >
> > > > > Any thoughts on what I should try next?
> > > > >
> > > > > Ryan
> > > > >
> > > > > On 6/14/06, Darren Dale <dd55@...163...> wrote:
> > > > > > On Wednesday 14 June 2006 18:51, you wrote:
> > > > > > > There was a lot of stuff in my tex.cache, but deleting didn't
> > > > > > > solve my problem.
> > > > > > >
> > > > > > > I may have some strange choices for my fonts and font sizes.
> > > > > > > Can you send me a copy of your matplotlibrc file.
> > > > > > >
> > > > > > > Ryan
> > > > > > >
> > > > > > > On 6/14/06, Darren Dale <dd55@...163...> wrote:
> > > > > > > > Hi Ryan,
> > > > > > > >
> > > > > > > > I'm using the latest svn as well (2479), and I cant
> > > > > > > > reproduce your problem. Try deleting your tex.cache.
> > > > > > > >
> > > > > > > > Darren
> > > > > > > >
> > > > > > > > On Wednesday 14 June 2006 18:14, Ryan Krauss wrote:
> > > > > > > > > I am having a problem with the fonts for exponents on
> > > > > > > > > semilog plots with usetex.
> > > > > > > > >
> > > > > > > > > The attached figure can be generated on my machine with
> > > > > > > > > figure(1)
> > > > > > > > > t=arange(0,10,0.01)
> > > > > > > > > y=sin(2*pi*t)
> > > > > > > > > semilogx(t,y)
> > > > > > > > >
> > > > > > > > > I just upgraded to the latest svn and now the y-axis
> > > > > > > > > plots look different from the x-axis.
> > > > > > > > > matplotlib.__version__
> > > > > > > > > Out[6]: '0.87.3'
> > > > > > > > >
> > > > > > > > >
> > > > > > > > > Ryan
> > > > > > > >
> > > > > > > > --
> > > > > > > > Darren S. Dale, Ph.D.
> > > > > > > > Cornell High Energy Synchrotron Source
> > > > > > > > Cornell University
> > > > > > > > 200L Wilson Lab
> > > > > > > > Rt. 366 & Pine Tree Road
> > > > > > > > Ithaca, NY 14853
> > > > > > > >
> > > > > > > > dd55@...163...
> > > > > > > > office: (607) 255-9894
> > > > > > > > fax: (607) 255-9001
> > > > > > > >
> > > > > > > >
> > > > > > > > _______________________________________________
> > > > > > > > Matplotlib-users mailing list
> > > > > > > > Matplotlib-users@lists.sourceforge.net
> > > > > > > > https://lists.sourceforge.net/lists/listinfo/matplotlib-use
> > > > > > > >rs
> > > > > > >
> > > > > > > _______________________________________________
> > > > > > > Matplotlib-users mailing list
> > > > > > > Matplotlib-users@lists.sourceforge.net
> > > > > > > matplotlib-users List Signup and Options
> > > > > >
> > > > > > --
> > > > > > Darren S. Dale, Ph.D.
> > > > > > Cornell High Energy Synchrotron Source
> > > > > > Cornell University
> > > > > > 200L Wilson Lab
> > > > > > Rt. 366 & Pine Tree Road
> > > > > > Ithaca, NY 14853
> > > > > >
> > > > > > dd55@...163...
> > > > > > office: (607) 255-9894
> > > > > > fax: (607) 255-9001
> > > >
> > > > --
> > > > Darren S. Dale, Ph.D.
> > > > Cornell High Energy Synchrotron Source
> > > > Cornell University
> > > > 200L Wilson Lab
> > > > Rt. 366 & Pine Tree Road
> > > > Ithaca, NY 14853
> > > >
> > > > dd55@...163...
> > > > office: (607) 255-9894
> > > > fax: (607) 255-9001
> > > >
> > > >
> > > >
> > > >
> > > > _______________________________________________
> > > > Matplotlib-users mailing list
> > > > Matplotlib-users@lists.sourceforge.net
> > > > matplotlib-users List Signup and Options
--
Darren S. Dale, Ph.D.
dd55@...163...
Thanks Darren. My plots look gorgeous.
Ryan
···
On 6/18/06, Darren Dale <dd55@...163...> wrote:
We didnt get any comments against, so I committed the changes this morning. We
will no longer try to support sans-serif mathmode fonts with the usetex
option, since there is no native support for them in latex. If you are using
svn matplotlib, I suggest clearing your tex.cache after updating.
Darren
On Wednesday 14 June 2006 8:19 pm, Darren Dale wrote:
> I agree that this little experiment of trying to work around latex's
> limitations has been too much trouble. I suggest we go back to the old
> behavior, and anyone who wants sans-serif fonts in their exponents can use
> regular mathtext. I'm hopeful that Edin can make some strides with mpl's
> mathtext support, and in the meantime, people should get decent results if
> they set ps.useafm : True in their rc settings.
>
> Comments?
>
> On Wednesday 14 June 2006 19:53, Ryan Krauss wrote:
> > (Sorry, I submitted this email with a real figure instead of a toy
> > example and the file size was too big and it awaits moderator
> > approval).
> >
> > I am afraid I asked you to open a can of worms and now I don't know
> > what we should do. With my font size settings, \small looks to small
> > for the exponents. I tried \normalsize and actually got decent
> > results with \large (replacing all occurances of \small in your
> > ticker.py). See that attached file. But if \small looked good with
> > your settings, I am afraid things are now dependent on the font
> > settings in the rc file as far as what should go in the latex command
> > for the exponents.
> >
> > I remember that this problem came up because I complained about serif
> > fonts in my exponents and we were having a hard time making tex use
> > sans serif math fonts.
> >
> > Maybe the best solution is for me to go back in time and retract that
> > complaint.
> >
> > I don't know. Sorry about the mess this had made. I have plots I am
> > fairly happy with (I will poke around in my rc file and see if I can
> > find out why my x and y axis fonts look different).
> >
> > Ryan
> >
> > On 6/14/06, Ryan Krauss <ryanlists@...287...> wrote:
> > > I am afraid I asked you to open a can of worms and now I don't know
> > > what we should do. With my font size settings, \small looks to small
> > > for the exponents. I tried \normalsize and actually got decent
> > > results with \large (replacing all occurances of \small in your
> > > ticker.py). See that attached file. But if \small looked good with
> > > your settings, I am afraid things are now dependent on the font
> > > settings in the rc file as far as what should go in the latex command
> > > for the exponents.
> > >
> > > I remember that this problem came up because I complained about serif
> > > fonts in my exponents and we were having a hard time making tex use
> > > sans serif math fonts.
> > >
> > > Maybe the best solution is for me to go back in time and retract that
> > > complaint.
> > >
> > > I don't know. Sorry about the mess this had made. I have plots I am
> > > fairly happy with (I will poke around in my rc file and see if I can
> > > find out why my x and y axis fonts look different).
> > >
> > > Ryan
> > >
> > > On 6/14/06, Ryan Krauss <ryanlists@...287...> wrote:
> > > > I feel bad that I caused this problem and am now asking you to fix
> > > > it.
> > > >
> > > > Ryan
> > > >
> > > > On 6/14/06, Darren Dale <dd55@...163...> wrote:
> > > > > This is an artifact that was introduced when I tried to give you
> > > > > support for sans-serif fonts in the exponent. Try the attached
> > > > > ticker.py, it wraps the exponent in {\small}. Let me know if this
> > > > > is acceptable, and I'll commit it.
> > > > >
> > > > > On Wednesday 14 June 2006 19:14, Ryan Krauss wrote:
> > > > > > I still have the problem with large exponents with your
> > > > > > matplotlibrc file (but the y-axis plots are no longer different).
> > > > > >
> > > > > > Any thoughts on what I should try next?
> > > > > >
> > > > > > Ryan
> > > > > >
> > > > > > On 6/14/06, Darren Dale <dd55@...163...> wrote:
> > > > > > > On Wednesday 14 June 2006 18:51, you wrote:
> > > > > > > > There was a lot of stuff in my tex.cache, but deleting didn't
> > > > > > > > solve my problem.
> > > > > > > >
> > > > > > > > I may have some strange choices for my fonts and font sizes.
> > > > > > > > Can you send me a copy of your matplotlibrc file.
> > > > > > > >
> > > > > > > > Ryan
> > > > > > > >
> > > > > > > > On 6/14/06, Darren Dale <dd55@...163...> wrote:
> > > > > > > > > Hi Ryan,
> > > > > > > > >
> > > > > > > > > I'm using the latest svn as well (2479), and I cant
> > > > > > > > > reproduce your problem. Try deleting your tex.cache.
> > > > > > > > >
> > > > > > > > > Darren
> > > > > > > > >
> > > > > > > > > On Wednesday 14 June 2006 18:14, Ryan Krauss wrote:
> > > > > > > > > > I am having a problem with the fonts for exponents on
> > > > > > > > > > semilog plots with usetex.
> > > > > > > > > >
> > > > > > > > > > The attached figure can be generated on my machine with
> > > > > > > > > > figure(1)
> > > > > > > > > > t=arange(0,10,0.01)
> > > > > > > > > > y=sin(2*pi*t)
> > > > > > > > > > semilogx(t,y)
> > > > > > > > > >
> > > > > > > > > > I just upgraded to the latest svn and now the y-axis
> > > > > > > > > > plots look different from the x-axis.
> > > > > > > > > > matplotlib.__version__
> > > > > > > > > > Out[6]: '0.87.3'
> > > > > > > > > >
> > > > > > > > > > Ryan
> > > > > > > > >
> > > > > > > > > --
> > > > > > > > > Darren S. Dale, Ph.D.
> > > > > > > > > Cornell High Energy Synchrotron Source
> > > > > > > > > Cornell University
> > > > > > > > > 200L Wilson Lab
> > > > > > > > > Rt. 366 & Pine Tree Road
> > > > > > > > > Ithaca, NY 14853
> > > > > > > > >
> > > > > > > > > dd55@...163...
> > > > > > > > > office: (607) 255-9894
> > > > > > > > > fax: (607) 255-9001
> > > > > > > > >
> > > > > > > > > _______________________________________________
> > > > > > > > > Matplotlib-users mailing list
> > > > > > > > > Matplotlib-users@lists.sourceforge.net
> > > > > > > > > https://lists.sourceforge.net/lists/listinfo/matplotlib-use
> > > > > > > > >rs
> > > > > > > >
> > > > > > > > _______________________________________________
> > > > > > > > Matplotlib-users mailing list
> > > > > > > > Matplotlib-users@lists.sourceforge.net
> > > > > > > > matplotlib-users List Signup and Options
> > > > > > >
> > > > > > > --
> > > > > > > Darren S. Dale, Ph.D.
> > > > > > > Cornell High Energy Synchrotron Source
> > > > > > > Cornell University
> > > > > > > 200L Wilson Lab
> > > > > > > Rt. 366 & Pine Tree Road
> > > > > > > Ithaca, NY 14853
> > > > > > >
> > > > > > > dd55@...163...
> > > > > > > office: (607) 255-9894
> > > > > > > fax: (607) 255-9001
> > > > >
> > > > > --
> > > > > Darren S. Dale, Ph.D.
> > > > > Cornell High Energy Synchrotron Source
> > > > > Cornell University
> > > > > 200L Wilson Lab
> > > > > Rt. 366 & Pine Tree Road
> > > > > Ithaca, NY 14853
> > > > >
> > > > > dd55@...163...
> > > > > office: (607) 255-9894
> > > > > fax: (607) 255-9001
> > > > >
> > > > > _______________________________________________
> > > > > Matplotlib-users mailing list
> > > > > Matplotlib-users@lists.sourceforge.net
> > > > > matplotlib-users List Signup and Options
--
Darren S. Dale, Ph.D.
dd55@...163...
_______________________________________________
Matplotlib-users mailing list
Matplotlib-users@lists.sourceforge.net
matplotlib-users List Signup and Options