I still have the problem with large exponents with your matplotlibrc
file (but the y-axis plots are no longer different).
Any thoughts on what I should try next?
Ryan
···
On 6/14/06, Darren Dale <dd55@...163...> wrote:
On Wednesday 14 June 2006 18:51, you wrote:
> There was a lot of stuff in my tex.cache, but deleting didn't solve my
> problem.
>
> I may have some strange choices for my fonts and font sizes. Can you
> send me a copy of your matplotlibrc file.
>
> Ryan
>
> On 6/14/06, Darren Dale <dd55@...163...> wrote:
> > Hi Ryan,
> >
> > I'm using the latest svn as well (2479), and I cant reproduce your
> > problem. Try deleting your tex.cache.
> >
> > Darren
> >
> > On Wednesday 14 June 2006 18:14, Ryan Krauss wrote:
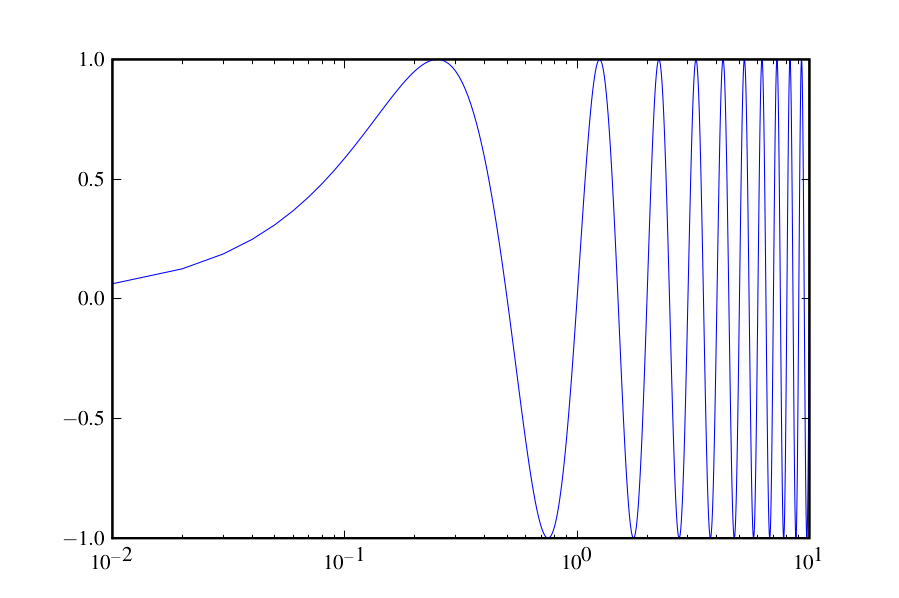
> > > I am having a problem with the fonts for exponents on semilog plots
> > > with usetex.
> > >
> > > The attached figure can be generated on my machine with
> > > figure(1)
> > > t=arange(0,10,0.01)
> > > y=sin(2*pi*t)
> > > semilogx(t,y)
> > >
> > > I just upgraded to the latest svn and now the y-axis plots look
> > > different from the x-axis.
> > > matplotlib.__version__
> > > Out[6]: '0.87.3'
> > >
> > > Ryan
> >
> > --
> > Darren S. Dale, Ph.D.
> > Cornell High Energy Synchrotron Source
> > Cornell University
> > 200L Wilson Lab
> > Rt. 366 & Pine Tree Road
> > Ithaca, NY 14853
> >
> > dd55@...163...
> > office: (607) 255-9894
> > fax: (607) 255-9001
> >
> > _______________________________________________
> > Matplotlib-users mailing list
> > Matplotlib-users@lists.sourceforge.net
> > matplotlib-users List Signup and Options
>
> _______________________________________________
> Matplotlib-users mailing list
> Matplotlib-users@lists.sourceforge.net
> matplotlib-users List Signup and Options
--
Darren S. Dale, Ph.D.
Cornell High Energy Synchrotron Source
Cornell University
200L Wilson Lab
Rt. 366 & Pine Tree Road
Ithaca, NY 14853
dd55@...163...
office: (607) 255-9894
fax: (607) 255-9001
This is an artifact that was introduced when I tried to give you support for
sans-serif fonts in the exponent. Try the attached ticker.py, it wraps the
exponent in {\small}. Let me know if this is acceptable, and I'll commit it.
ticker.py (31.4 KB)
···
On Wednesday 14 June 2006 19:14, Ryan Krauss wrote:
I still have the problem with large exponents with your matplotlibrc
file (but the y-axis plots are no longer different).
Any thoughts on what I should try next?
Ryan
On 6/14/06, Darren Dale <dd55@...163...> wrote:
> On Wednesday 14 June 2006 18:51, you wrote:
> > There was a lot of stuff in my tex.cache, but deleting didn't solve my
> > problem.
> >
> > I may have some strange choices for my fonts and font sizes. Can you
> > send me a copy of your matplotlibrc file.
> >
> > Ryan
> >
> > On 6/14/06, Darren Dale <dd55@...163...> wrote:
> > > Hi Ryan,
> > >
> > > I'm using the latest svn as well (2479), and I cant reproduce your
> > > problem. Try deleting your tex.cache.
> > >
> > > Darren
> > >
> > > On Wednesday 14 June 2006 18:14, Ryan Krauss wrote:
> > > > I am having a problem with the fonts for exponents on semilog plots
> > > > with usetex.
> > > >
> > > > The attached figure can be generated on my machine with
> > > > figure(1)
> > > > t=arange(0,10,0.01)
> > > > y=sin(2*pi*t)
> > > > semilogx(t,y)
> > > >
> > > > I just upgraded to the latest svn and now the y-axis plots look
> > > > different from the x-axis.
> > > > matplotlib.__version__
> > > > Out[6]: '0.87.3'
> > > >
> > > >
> > > > Ryan
> > >
> > > --
> > > Darren S. Dale, Ph.D.
> > > Cornell High Energy Synchrotron Source
> > > Cornell University
> > > 200L Wilson Lab
> > > Rt. 366 & Pine Tree Road
> > > Ithaca, NY 14853
> > >
> > > dd55@...163...
> > > office: (607) 255-9894
> > > fax: (607) 255-9001
> > >
> > >
> > > _______________________________________________
> > > Matplotlib-users mailing list
> > > Matplotlib-users@lists.sourceforge.net
> > > matplotlib-users List Signup and Options
> >
> > _______________________________________________
> > Matplotlib-users mailing list
> > Matplotlib-users@lists.sourceforge.net
> > matplotlib-users List Signup and Options
>
> --
> Darren S. Dale, Ph.D.
> Cornell High Energy Synchrotron Source
> Cornell University
> 200L Wilson Lab
> Rt. 366 & Pine Tree Road
> Ithaca, NY 14853
>
> dd55@...163...
> office: (607) 255-9894
> fax: (607) 255-9001
--
Darren S. Dale, Ph.D.
Cornell High Energy Synchrotron Source
Cornell University
200L Wilson Lab
Rt. 366 & Pine Tree Road
Ithaca, NY 14853
dd55@...163...
office: (607) 255-9894
fax: (607) 255-9001
I feel bad that I caused this problem and am now asking you to fix it.
Ryan
···
On 6/14/06, Darren Dale <dd55@...163...> wrote:
This is an artifact that was introduced when I tried to give you support for
sans-serif fonts in the exponent. Try the attached ticker.py, it wraps the
exponent in {\small}. Let me know if this is acceptable, and I'll commit it.
On Wednesday 14 June 2006 19:14, Ryan Krauss wrote:
> I still have the problem with large exponents with your matplotlibrc
> file (but the y-axis plots are no longer different).
>
> Any thoughts on what I should try next?
>
> Ryan
>
> On 6/14/06, Darren Dale <dd55@...163...> wrote:
> > On Wednesday 14 June 2006 18:51, you wrote:
> > > There was a lot of stuff in my tex.cache, but deleting didn't solve my
> > > problem.
> > >
> > > I may have some strange choices for my fonts and font sizes. Can you
> > > send me a copy of your matplotlibrc file.
> > >
> > > Ryan
> > >
> > > On 6/14/06, Darren Dale <dd55@...163...> wrote:
> > > > Hi Ryan,
> > > >
> > > > I'm using the latest svn as well (2479), and I cant reproduce your
> > > > problem. Try deleting your tex.cache.
> > > >
> > > > Darren
> > > >
> > > > On Wednesday 14 June 2006 18:14, Ryan Krauss wrote:
> > > > > I am having a problem with the fonts for exponents on semilog plots
> > > > > with usetex.
> > > > >
> > > > > The attached figure can be generated on my machine with
> > > > > figure(1)
> > > > > t=arange(0,10,0.01)
> > > > > y=sin(2*pi*t)
> > > > > semilogx(t,y)
> > > > >
> > > > > I just upgraded to the latest svn and now the y-axis plots look
> > > > > different from the x-axis.
> > > > > matplotlib.__version__
> > > > > Out[6]: '0.87.3'
> > > > >
> > > > > Ryan
> > > >
> > > > --
> > > > Darren S. Dale, Ph.D.
> > > > Cornell High Energy Synchrotron Source
> > > > Cornell University
> > > > 200L Wilson Lab
> > > > Rt. 366 & Pine Tree Road
> > > > Ithaca, NY 14853
> > > >
> > > > dd55@...163...
> > > > office: (607) 255-9894
> > > > fax: (607) 255-9001
> > > >
> > > > _______________________________________________
> > > > Matplotlib-users mailing list
> > > > Matplotlib-users@lists.sourceforge.net
> > > > matplotlib-users List Signup and Options
> > >
> > > _______________________________________________
> > > Matplotlib-users mailing list
> > > Matplotlib-users@lists.sourceforge.net
> > > matplotlib-users List Signup and Options
> >
> > --
> > Darren S. Dale, Ph.D.
> > Cornell High Energy Synchrotron Source
> > Cornell University
> > 200L Wilson Lab
> > Rt. 366 & Pine Tree Road
> > Ithaca, NY 14853
> >
> > dd55@...163...
> > office: (607) 255-9894
> > fax: (607) 255-9001
--
Darren S. Dale, Ph.D.
Cornell High Energy Synchrotron Source
Cornell University
200L Wilson Lab
Rt. 366 & Pine Tree Road
Ithaca, NY 14853
dd55@...163...
office: (607) 255-9894
fax: (607) 255-9001
_______________________________________________
Matplotlib-users mailing list
Matplotlib-users@lists.sourceforge.net
matplotlib-users List Signup and Options
I didnt mean to come across so terse, I'm just really busy at work these days.
So don't worry about it. I'm finishing a paper and am glad you caught the bug
before I submitted the final draft.
Darren
···
On Wednesday 14 June 2006 19:30, Ryan Krauss wrote:
I feel bad that I caused this problem and am now asking you to fix it.
Ryan
On 6/14/06, Darren Dale <dd55@...163...> wrote:
> This is an artifact that was introduced when I tried to give you support
> for sans-serif fonts in the exponent. Try the attached ticker.py, it
> wraps the exponent in {\small}. Let me know if this is acceptable, and
> I'll commit it.
>
> On Wednesday 14 June 2006 19:14, Ryan Krauss wrote:
> > I still have the problem with large exponents with your matplotlibrc
> > file (but the y-axis plots are no longer different).
> >
> > Any thoughts on what I should try next?
> >
> > Ryan
> >
> > On 6/14/06, Darren Dale <dd55@...163...> wrote:
> > > On Wednesday 14 June 2006 18:51, you wrote:
> > > > There was a lot of stuff in my tex.cache, but deleting didn't solve
> > > > my problem.
> > > >
> > > > I may have some strange choices for my fonts and font sizes. Can
> > > > you send me a copy of your matplotlibrc file.
> > > >
> > > > Ryan
> > > >
> > > > On 6/14/06, Darren Dale <dd55@...163...> wrote:
> > > > > Hi Ryan,
> > > > >
> > > > > I'm using the latest svn as well (2479), and I cant reproduce
> > > > > your problem. Try deleting your tex.cache.
> > > > >
> > > > > Darren
> > > > >
> > > > > On Wednesday 14 June 2006 18:14, Ryan Krauss wrote:
> > > > > > I am having a problem with the fonts for exponents on semilog
> > > > > > plots with usetex.
> > > > > >
> > > > > > The attached figure can be generated on my machine with
> > > > > > figure(1)
> > > > > > t=arange(0,10,0.01)
> > > > > > y=sin(2*pi*t)
> > > > > > semilogx(t,y)
> > > > > >
> > > > > > I just upgraded to the latest svn and now the y-axis plots look
> > > > > > different from the x-axis.
> > > > > > matplotlib.__version__
> > > > > > Out[6]: '0.87.3'
> > > > > >
> > > > > >
> > > > > > Ryan
> > > > >
> > > > > --
> > > > > Darren S. Dale, Ph.D.
> > > > > Cornell High Energy Synchrotron Source
> > > > > Cornell University
> > > > > 200L Wilson Lab
> > > > > Rt. 366 & Pine Tree Road
> > > > > Ithaca, NY 14853
> > > > >
> > > > > dd55@...163...
> > > > > office: (607) 255-9894
> > > > > fax: (607) 255-9001
> > > > >
> > > > >
> > > > > _______________________________________________
> > > > > Matplotlib-users mailing list
> > > > > Matplotlib-users@lists.sourceforge.net
> > > > > matplotlib-users List Signup and Options
> > > >
> > > > _______________________________________________
> > > > Matplotlib-users mailing list
> > > > Matplotlib-users@lists.sourceforge.net
> > > > matplotlib-users List Signup and Options
> > >
> > > --
> > > Darren S. Dale, Ph.D.
> > > Cornell High Energy Synchrotron Source
> > > Cornell University
> > > 200L Wilson Lab
> > > Rt. 366 & Pine Tree Road
> > > Ithaca, NY 14853
> > >
> > > dd55@...163...
> > > office: (607) 255-9894
> > > fax: (607) 255-9001
>
> --
> Darren S. Dale, Ph.D.
> Cornell High Energy Synchrotron Source
> Cornell University
> 200L Wilson Lab
> Rt. 366 & Pine Tree Road
> Ithaca, NY 14853
>
> dd55@...163...
> office: (607) 255-9894
> fax: (607) 255-9001
>
>
>
>
> _______________________________________________
> Matplotlib-users mailing list
> Matplotlib-users@lists.sourceforge.net
> matplotlib-users List Signup and Options
_______________________________________________
Matplotlib-users mailing list
Matplotlib-users@lists.sourceforge.net
matplotlib-users List Signup and Options
--
Darren S. Dale, Ph.D.
Cornell High Energy Synchrotron Source
Cornell University
200L Wilson Lab
Rt. 366 & Pine Tree Road
Ithaca, NY 14853
dd55@...163...
office: (607) 255-9894
fax: (607) 255-9001