Is there a way to create a line plot similar to Mathematica’s PlotFilling->Axis option for ListPlot?
It is a plot of a vector as a line plot, but for each point, there is a vertical line dropped down to the axis. It is demonstrated on the following link:
It is a plot of a vector as a line plot, but for each point, there is a vertical line dropped down to the axis. It is demonstrated on the following link:
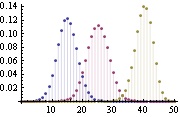
I was thinking more like the tiny attachment (hope attachments are ok). Basically, given a list of (x,y) coordinates, plot the (x,y) point as a little circle and drop a line down from the point to the x-axis (but not fill the whole region under the plot).
It’s very nice for plotting a sparse signal, where most of the y’s are equal to zero but some are not.
Thanks,
Art.
···
On Wed, Jun 24, 2009 at 7:18 PM, Eric Firing <efiring@…202…> wrote:
Art wrote:
Is there a way to create a line plot similar to Mathematica’s PlotFilling->Axis option for ListPlot?
It is a plot of a vector as a line plot, but for each point, there is a vertical line dropped down to the axis. It is demonstrated on the following link:
On Wed, Jun 24, 2009 at 3:32 PM, Art<grenander@...287...> wrote:
Hi Eric,
I was thinking more like the tiny attachment (hope attachments are ok).
Basically, given a list of (x,y) coordinates, plot the (x,y) point as a
little circle and drop a line down from the point to the x-axis (but not
fill the whole region under the plot).
It's very nice for plotting a sparse signal, where most of the y's are equal
to zero but some are not.
Thanks,
Art.
On Wed, Jun 24, 2009 at 7:18 PM, Eric Firing <efiring@...202...> wrote:
Art wrote:
Is there a way to create a line plot similar to Mathematica's
PlotFilling->Axis option for ListPlot?
It is a plot of a vector as a line plot, but for each point, there is a
vertical line dropped down to the axis. It is demonstrated on the following
link: